INSTITUTIONAL FINANCE · UX RESEARCH◆ DESIGN RESEARCH · INSTITUTIONAL TRADING SYSTEM
TradeX Institutional Trading Terminal
L2 Order Book, Portfolio Risk Matrix (80+ funds), real-time P&L attribution, keyboard-first execution —
built for L/S equity PMs running $1B–$10B books who cannot afford to context-switch during the open.
Grounded in informal PM conversations and direct production exposure from
ACY Connect — FIX 4.4 institutional platform serving hedge funds and
prime brokers in production.
See also: TradeX Hedge Fund (PM strategy and cognitive workflow layer).
Concept design study — figures are design scope (surfaces, data density, the regulatory frameworks designed against), not production outcomes. FIX 4.4 literacy comes from production exposure at ACY Connect.
The interaction rules in this terminal — partial fill state display, session-aware SOR routing,
single-instrument depth focus, keyboard-first cancel/modify workflows — are not borrowed from Bloomberg
screenshots. They are derived from ACY Connect's FIX 4.4 protocol
work (production, 12+ institutional clients): Tag 39 OrdStatus lifecycle, session state machines,
and anti-pattern constraints that govern real institutional order flow. Concept work grounded in protocol
reality.
Live Interactive Prototype
All data simulated · Updates every 350–800ms
TradeX Institutional Terminal · Interactive Prototype · Simulated Live Data ·
Exchange-Level Infrastructure Demo
Why TradeX Exists
My production work spans institutional B2B infrastructure (ACY
Connect FIX API platform) and retail trading interfaces (LogixTrader, Finlogix, TradingCup).
TradeX extends that experience into terminal UX for portfolio managers handling $100M–$50B AUM — applying what I know about institutional order flow to a different scale of problem.
ACY Connect is where I ship institutional infrastructure — FIX Protocol integration for hedge funds and prime brokers. The technical logic mapping from that production work — deconstructing FIX message states like 35=8 (Execution Report) and 35=W (Snapshot) with our Tech Lead and QA — gave me the institutional foundation to design the TradeX terminal.
Three institutional design challenges I explored:
Level 2 Order Book: Bid/ask depth, spread dynamics, liquidity heat maps. Inspired
by order flow patterns from ACY Connect's FIX documentation work.
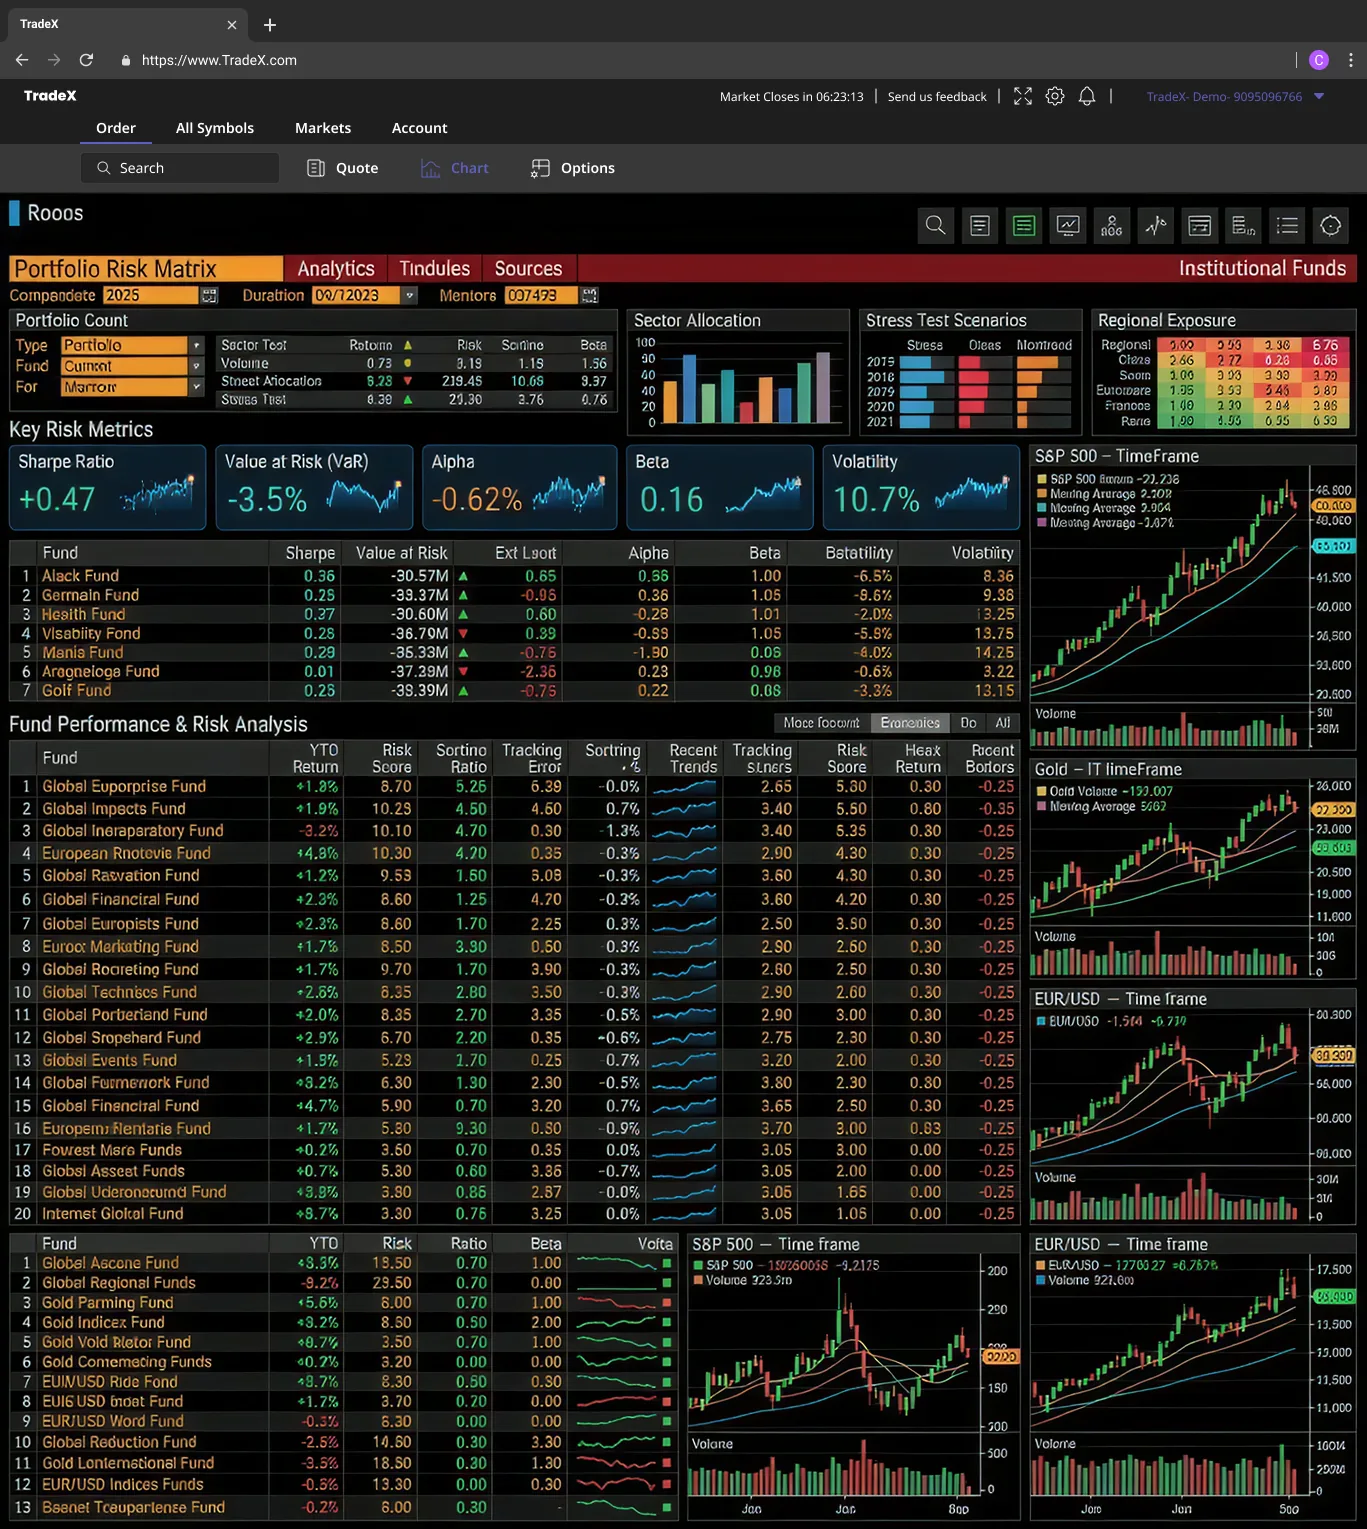
Portfolio Risk Attribution: 80+ funds with real-time VaR, Sharpe Ratio, Alpha, Beta
across sector/regional exposure.
What "portfolio manager interviews" actually covered:
Production Exposure
ACY Connect FIX 4.4 — shipped platform serving hedge funds and prime brokers. Direct exposure
to institutional order flow, execution reports, and position management workflows.
Unstructured Interviews (n=3)
45–60 min conversations with one PM, one quant analyst, one buy-side risk officer. Not
validation sessions. Findings seeded the cognitive-state framework and four unmet-demand
categories.
Bloomberg Analysis
Trial access plus systematic review of Bloomberg's command structure and IA; supplemented by
FactSet public documentation and Coalition Greenwich terminal adoption research.
TradeX is a design hypothesis built on production FIX exposure, not a
user-validated product. Treating it as anything else would be dishonest.
What I Designed
Portfolio Risk Matrix — 960 data points across 80+ funds, single-page architecture without progressive disclosure
Pre-trade compliance overlay — SEC 17a-4 / FINRA Rule 2111 violations caught in the trade ticket, not after legal review
Level 2 Order Book — Bid/ask depth heat map, liquidity gradient, quick-execution interface
Live exchange data feed — All prices, depth, and execution states are simulated
Real FIX 4.4 execution path — Referenced from ACY Connect production, not rebuilt here
Validated quant models — VaR, Sharpe, Alpha, Beta are visualisation primitives, not calibrated
PM user testing — Directional unstructured interviews (n=3), not validation sessions
SEC 17a-4 certification — Audit-trail design pattern is documented, not audited
Status & Honesty
Institutional concept exploration · Not in production · Speculative prototype. Built from production-grade adjacent work — ACY Connect FIX 4.4 institutional platform, real prime-brokerage requirements, Bloomberg architecture analysis. Original IP, no client overlap.
Every claim in this case study is labelled as production-derived or research-extrapolated. Read as a research artefact, not a shipped product.
The full case study
The risk matrix, the microstructure views, and the compliance architecture — read in full, or stop at the summary above.
01 Risk & Compliance Architecture02 Design Decisions03 SEC/FINRA Pre-Trade Compliance04 Portfolio Risk Matrix05 Level 2 Order Book06 Multi-Chart Orchestration07 Adaptive UI08 What This Shows09 Reflection
TradeX's matrix architecture is derived from the same constraint logic as FIX protocol design:
risk managers need fund-level volatility without navigating away; compliance
officers need filing status inline with trading activity — not in a separate system. The layout
reflects how information flows in production institutional workflows, not how Bloomberg chose to display
it.
2. Design Decisions — Why This, Not That
Each decision below documents the alternative I rejected and the reasoning behind it — grounded in direct protocol experience from ACY Connect's FIX 4.4 production system, not from reading Bloomberg screenshots.
Decision 1 — Data Density
Single-page 960 data points, not progressive disclosure
Alternative rejected: Drill-down navigation (click fund
→ detail view). Standard in retail dashboards.
Why: From the PM conversations — portfolio managers monitor 80+ funds simultaneously
during trading hours. Context switching kills reaction time. Every navigation click is latency in a
position decision. Density isn't a style choice; it's a workflow constraint.
Decision 2 — Order Book Focus
Single-instrument L2 depth, not
multi-instrument overview
Alternative rejected: Show bid/ask for multiple
instruments simultaneously.
Why: A single FIX session can carry quotes for hundreds of symbols — the protocol
doesn't force single-instrument UI. The cognition does. A PM cannot eye-parse two L2 books in parallel
without measurable decision degradation; Tag 150 ExecType state for AAPL bleeds into MSFT depth in
peripheral vision under stress. Keyboard context-switching (Alt+O) is faster than the eye and keeps
each instrument's microstructure quarantined.
Decision 3 — Compliance Timing
Pre-execution constraint display, not post-submission errors
Alternative rejected: Surface SEC Rule 15c3-1 / FINRA
margin violations after order submission (standard retail pattern).
Why: In retail, a rejected order is a minor friction. In institutional execution, a
compliance rejection after submission triggers a reporting obligation and a trade reconstruction
audit. The cost of the error changes the design requirement — surface the constraint before the trader
commits, not after.
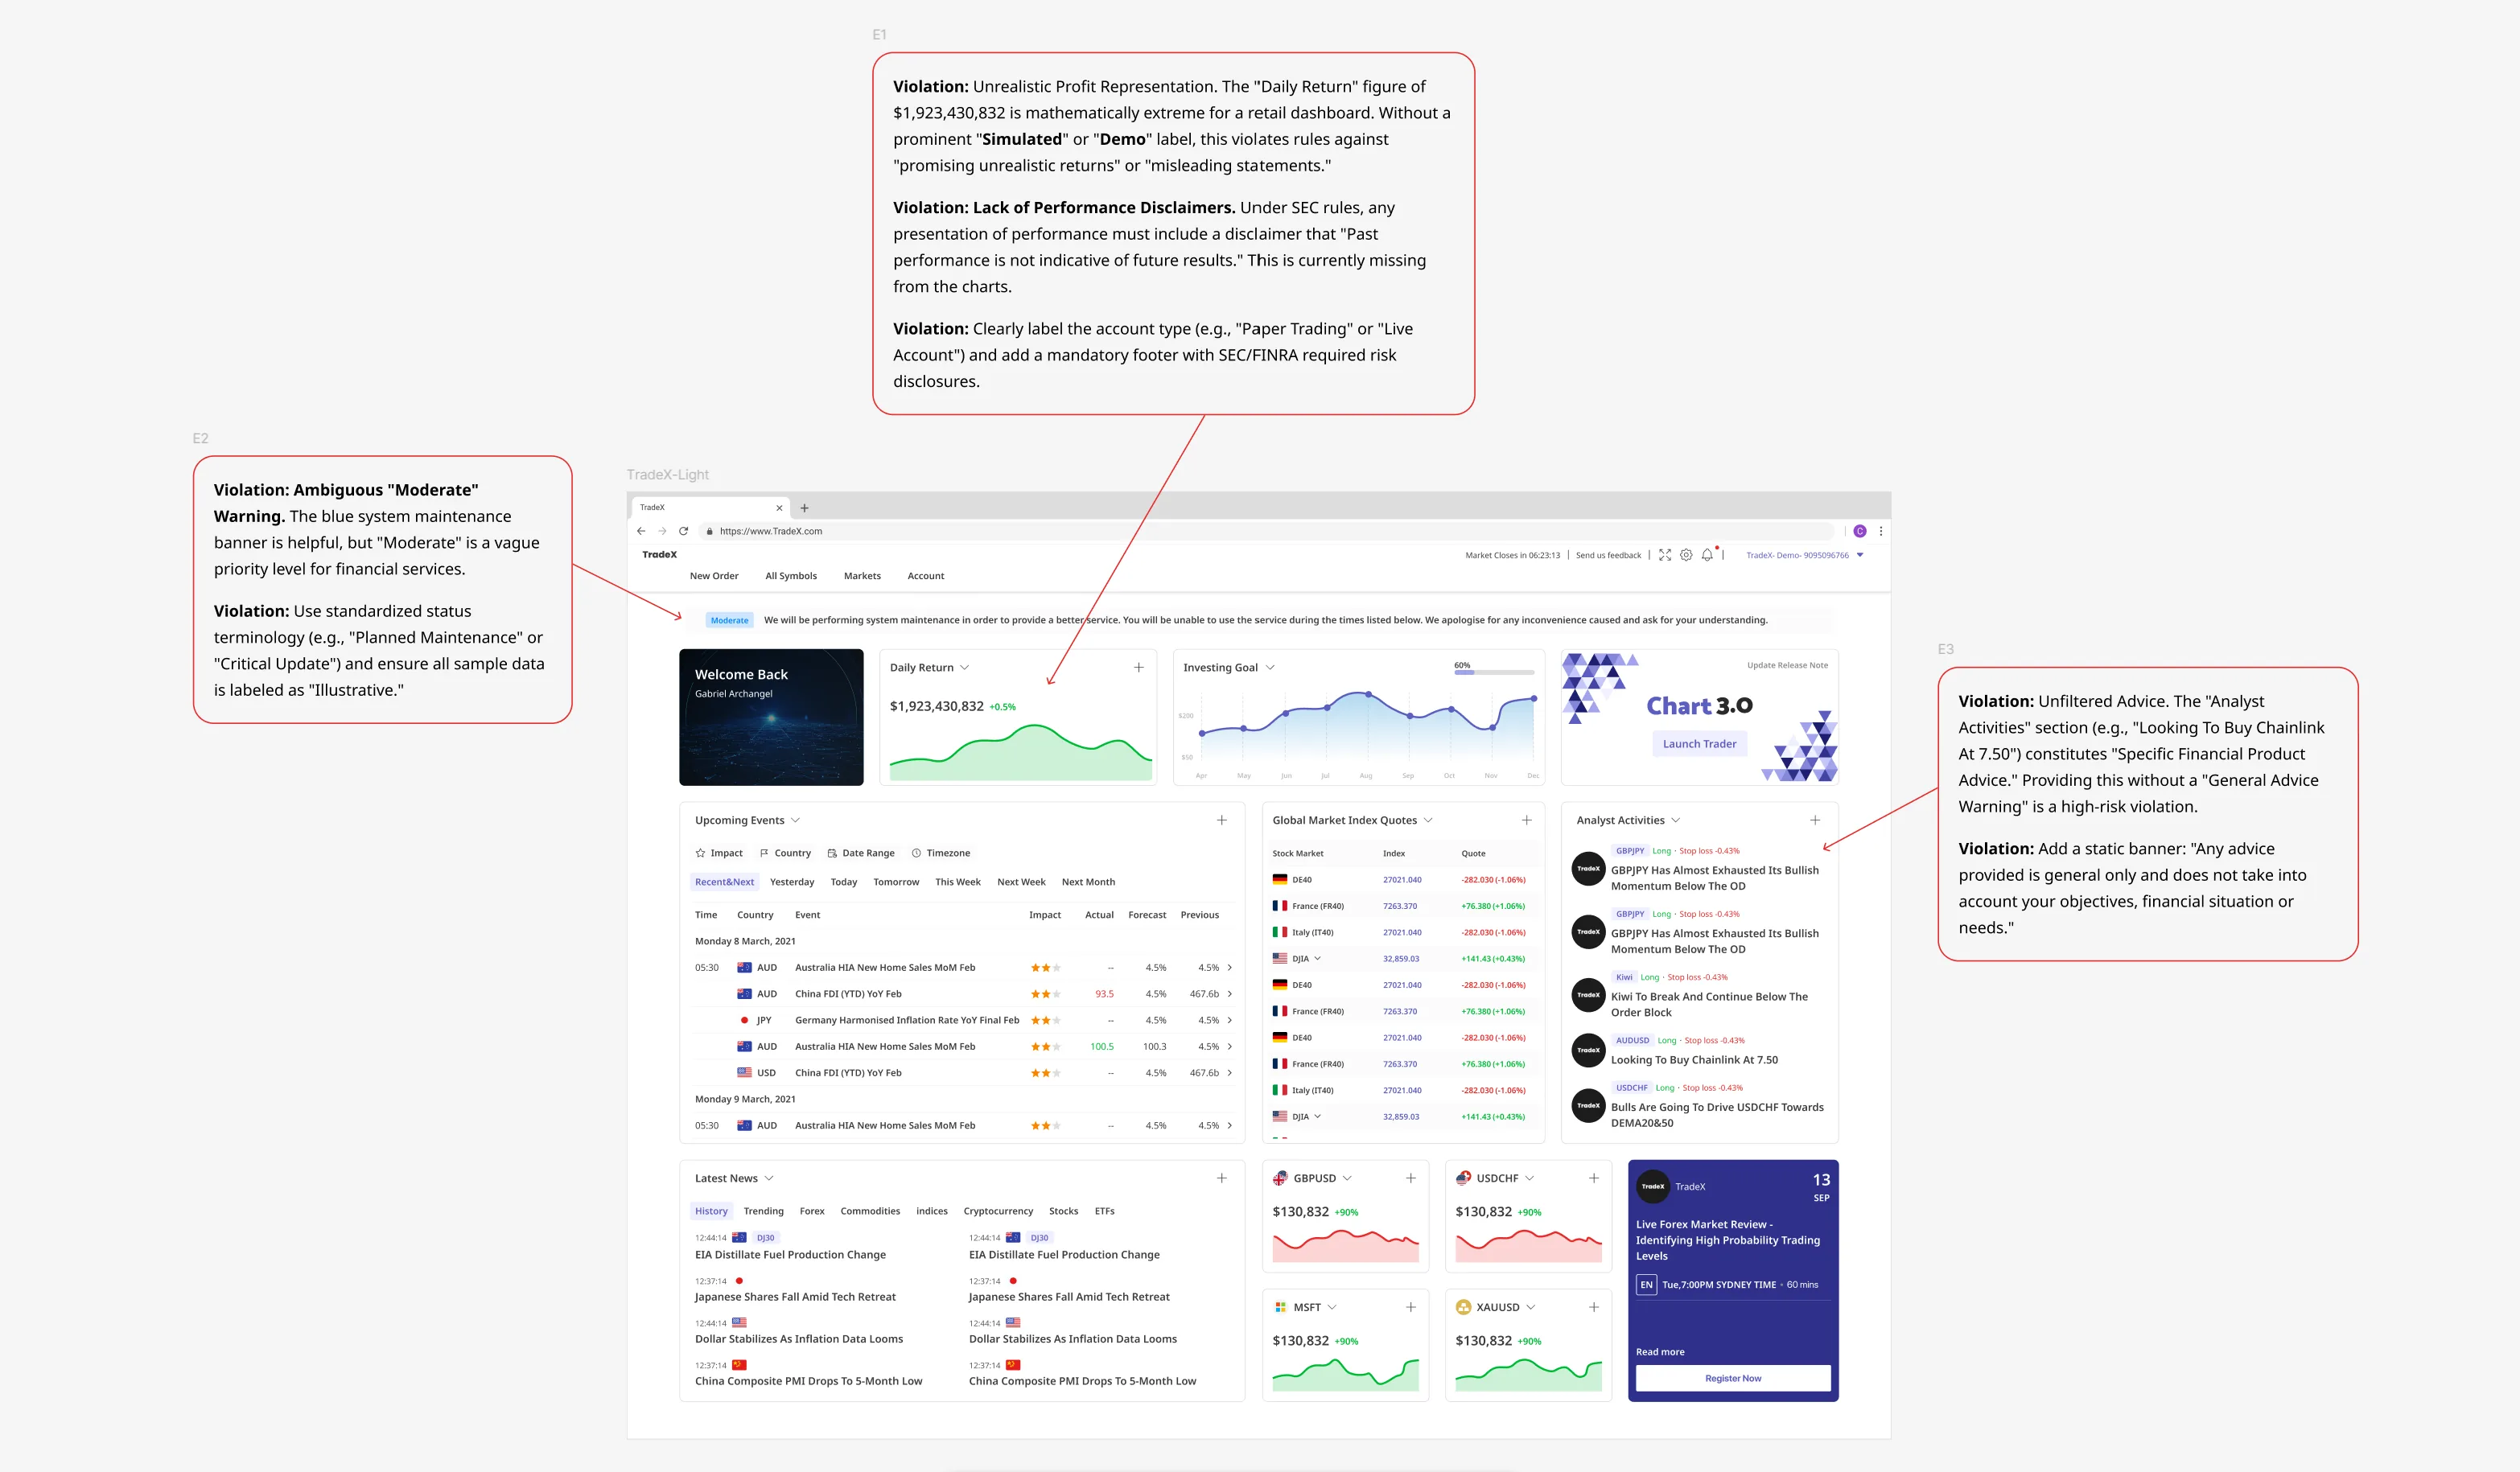
3. SEC/FINRA Compliance: Catching Violations BEFORE Legal Review
Why this matters for institutional platforms: UHNW-serving broker-dealers operate
under tight SEC/FINRA scrutiny. FINRA's 2024 disciplinary statistics show broker-dealer settlements
cluster in the $250K–$5M range, with rule-violation outliers reaching nine figures — rare, but
career-ending when they land. The workflow below shows how I surface potential violations inside the
design work, before Legal review, not after implementation.
While TradeX is a concept project, this compliance review process is exactly how I
work with Legal teams at ACY Securities. Internal ACY platform screenshots are available
during interviews; the workflow shown here is identical to production.
Real-world compliance review workflow: Identifying potential violations
before implementation
What This Workflow Shows
Violation 1: Unrealistic Profit Representation
Daily Return figure of $1.9M is extreme for a retail dashboard without "Simulated" labels.
Solution: Add mandatory SEC risk disclosures.
Violation 2: Ambiguous Risk Warnings
"Moderate" is vague for maintenance banners. Solution: Use standardized status terminology
required for audit trails.
Proactive Compliance Design:
Identify violations before Legal review (saving weeks of rework)
Translate regulatory requirements into specific design constraints
Document compliance rationale for audit trails
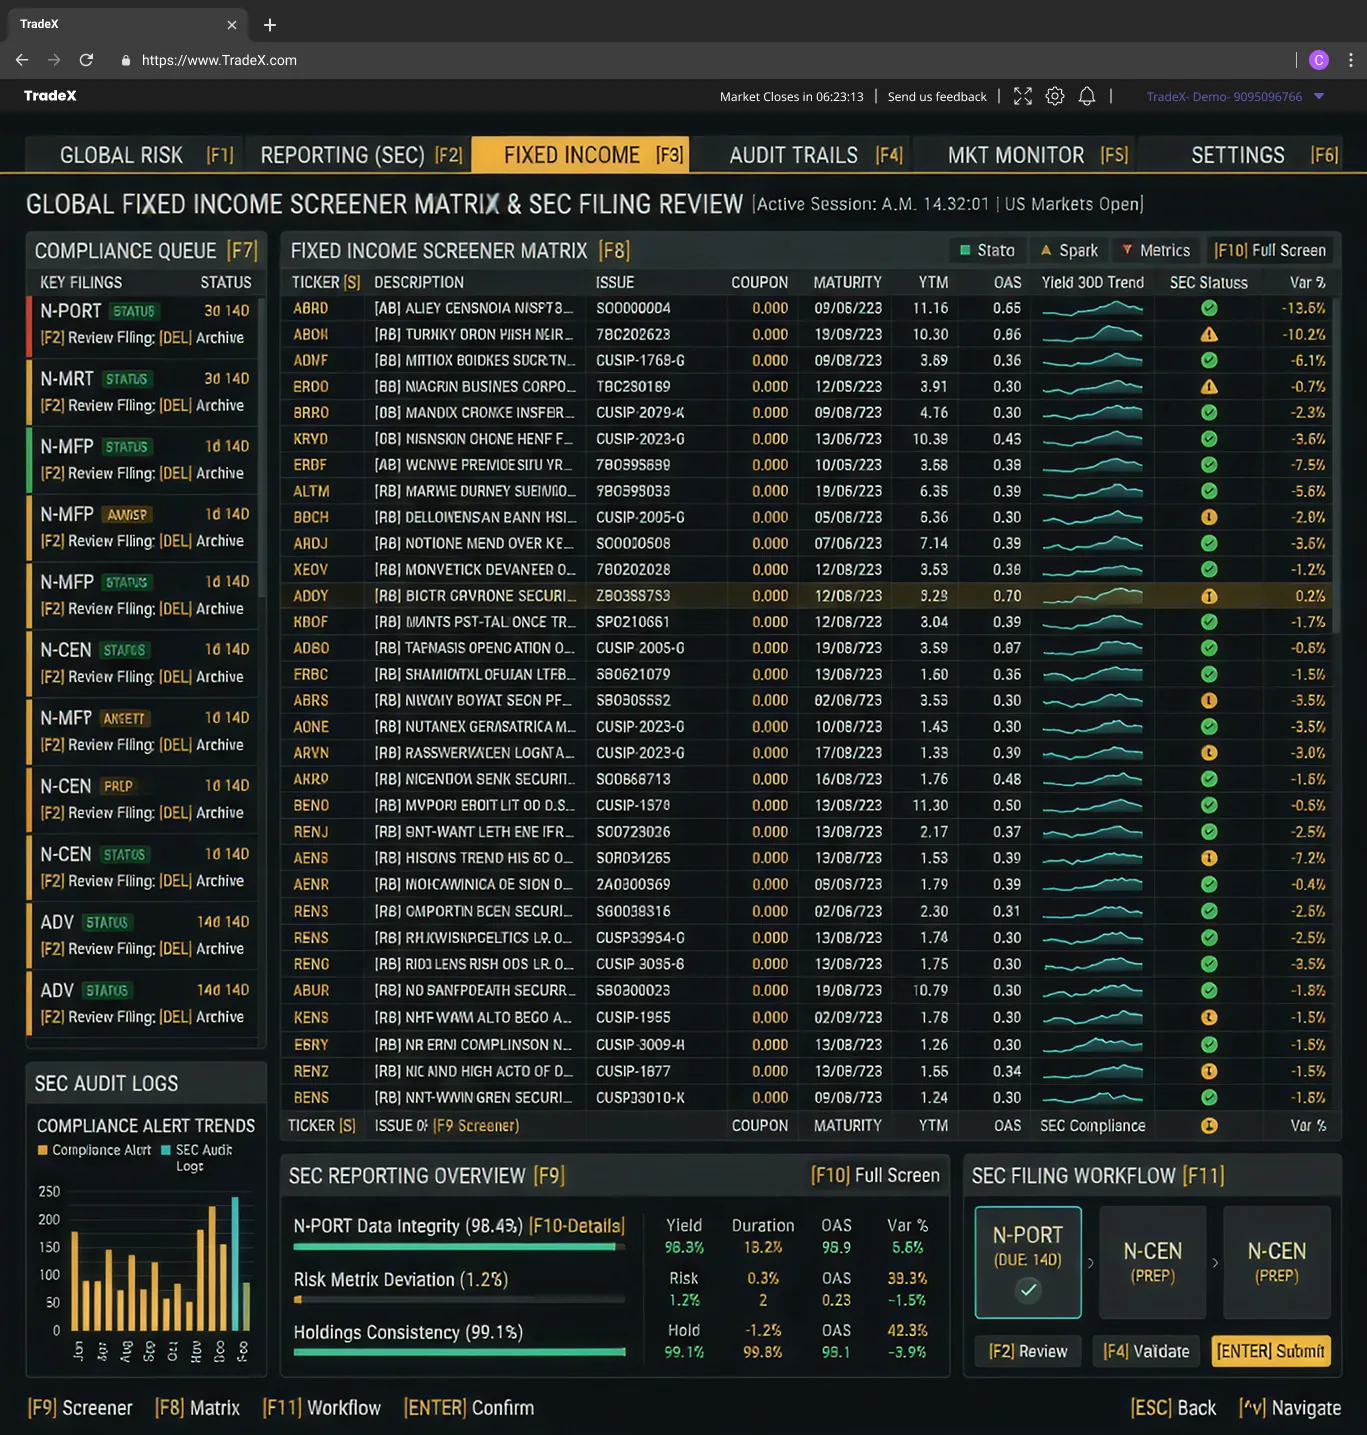
Real-World Institutional Compliance: Fixed Income Screener & SEC Filing Review
The interface demonstrates a production-grade institutional compliance workflow.
This shows how regulatory review is integrated directly into the trading terminal.
1. SEC Filing Queue: N-PORT, N-MFP, N-CEN filing
status tracking with "STAT05" standardized compliance codes.
2. Bond Screener Matrix: Real-time bond screening
with CUSIP identifiers, OAS spreads, and SEC-required risk indicators.
3. SEC Audit Trails: Live monitoring of filing
health metrics (98.43% data integrity) and violation frequency trends.
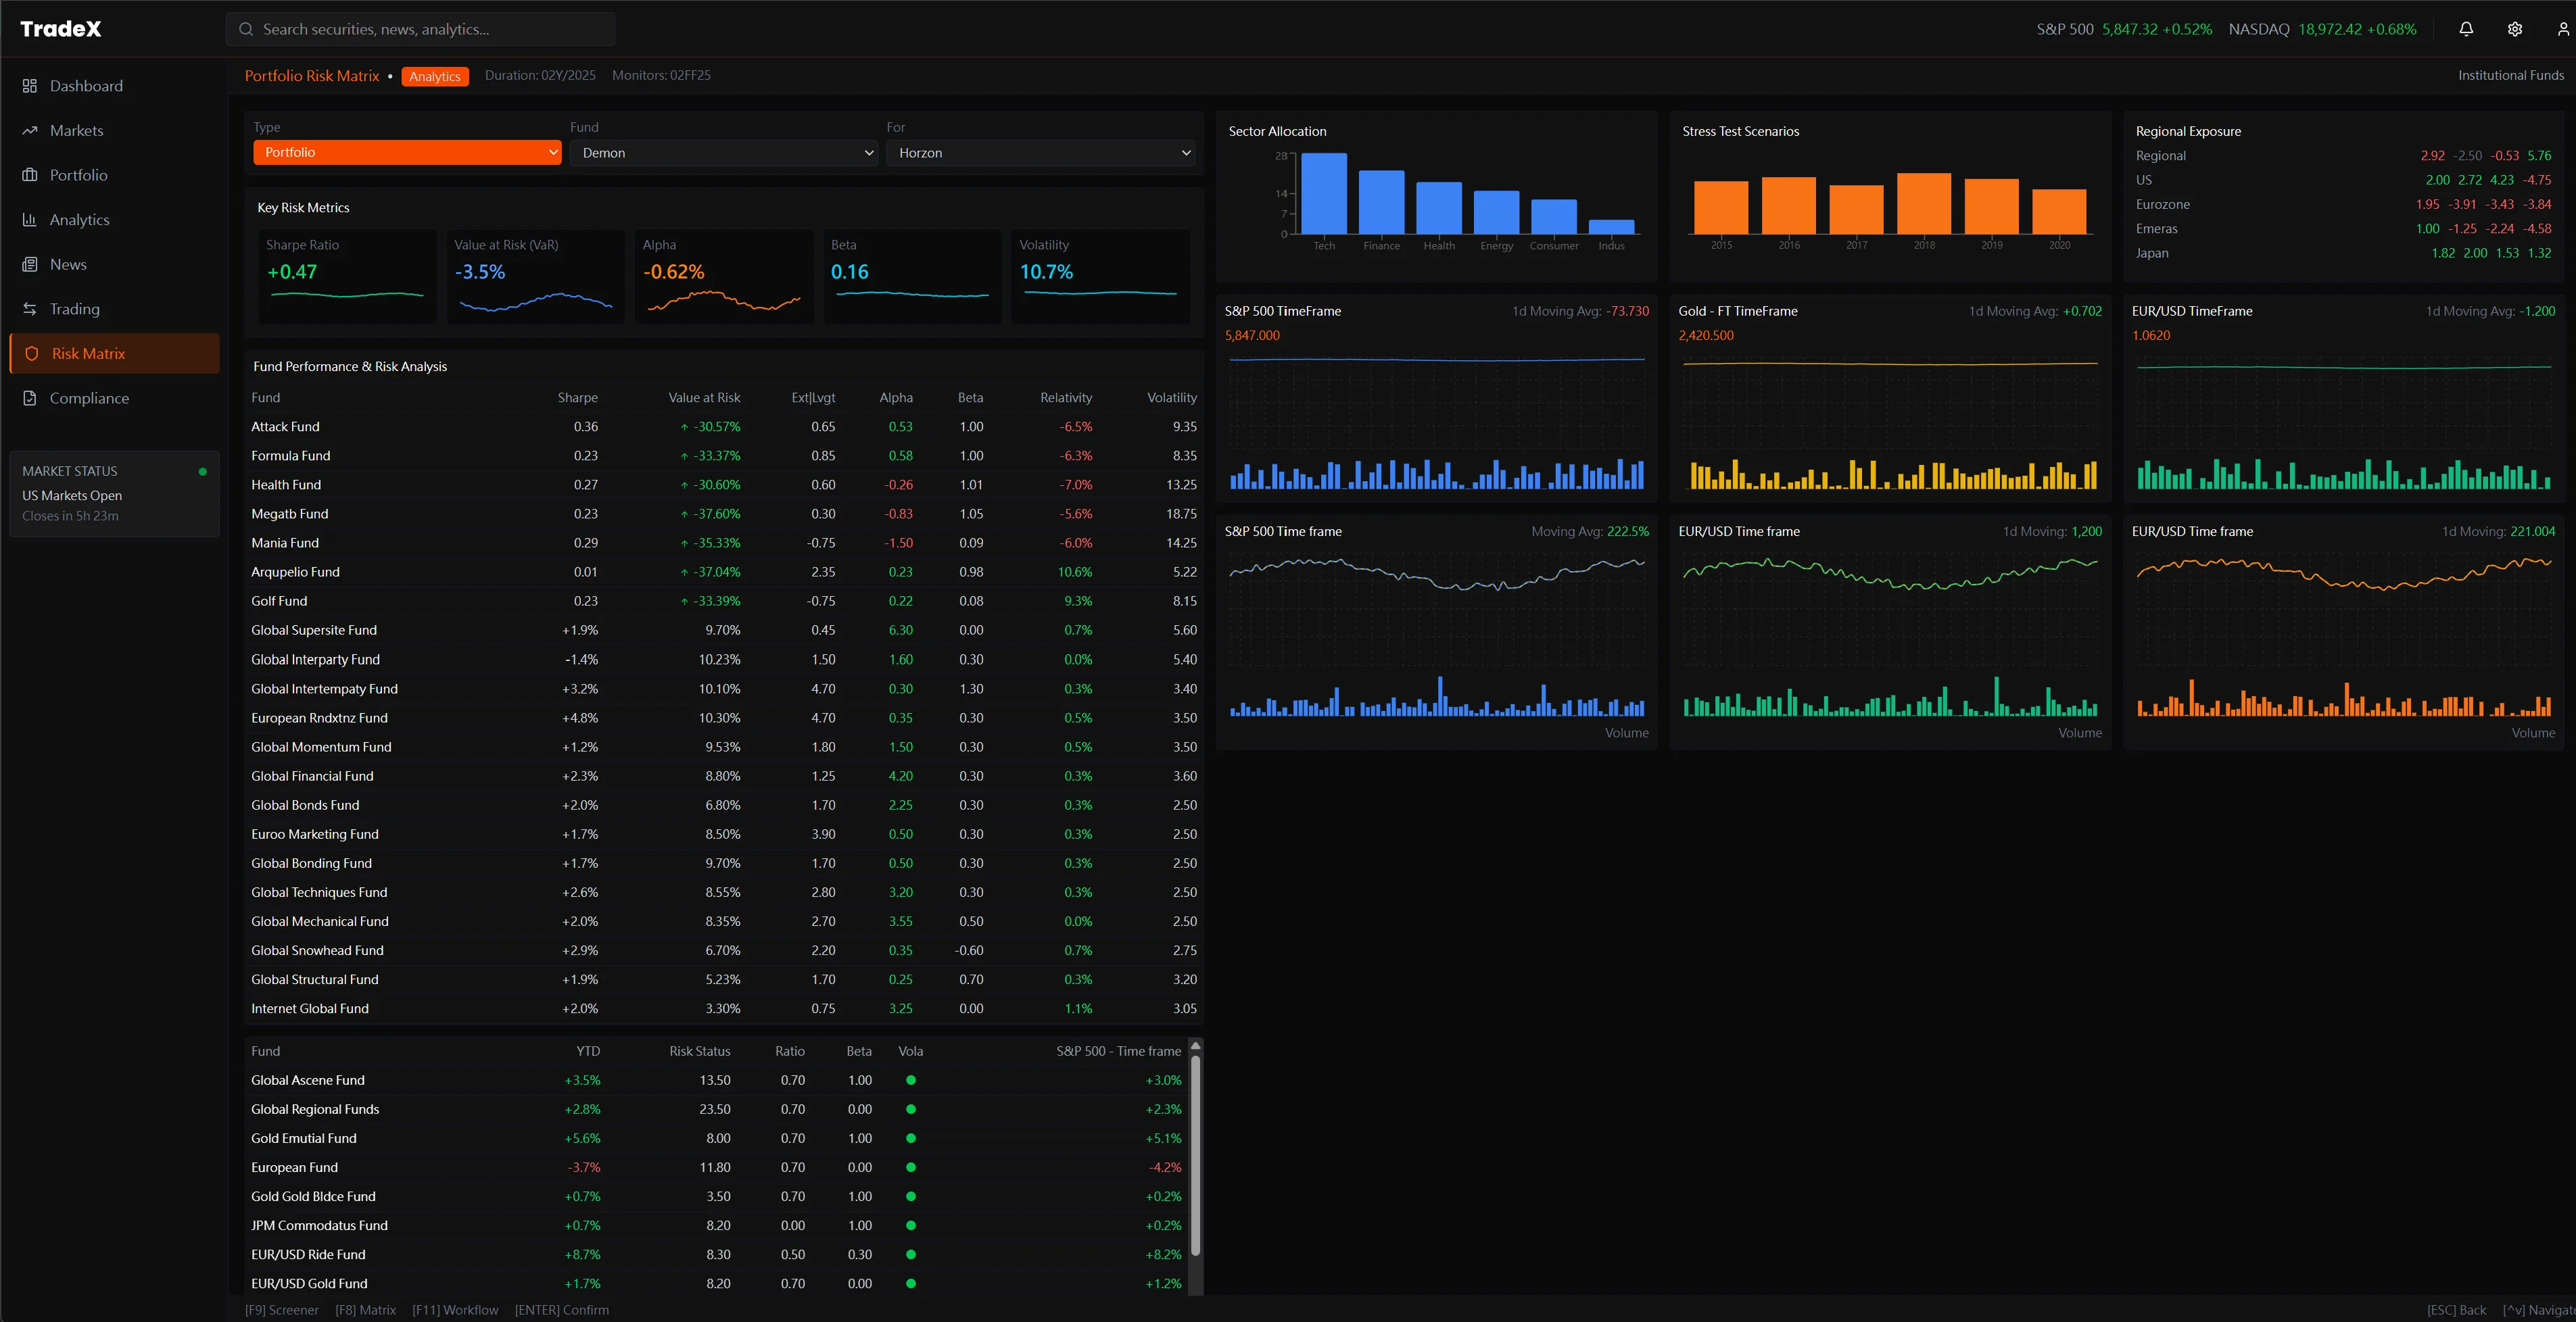
4. Portfolio Risk Matrix Design
960 Data Points Without Cognitive Overload
80 funds × 12 metrics = 960 concurrent data points. How do you keep it scannable?
Layer 1: Critical Outliers
VaR and Sharpe Ratio outliers highlighted via font-weight and color-coded severity.
Layer 2: Metadata
Supporting fund IDs and regional tags dimmed at 60% opacity to reduce visual noise.
What This Demonstrates:
Extreme Data Density: Managing 900+ points without cognitive collapse.
Risk Severity Categorization: Using heat-mapping for VaR limits.
Institutional Scannability: Typographic hierarchy optimized for pro trading.
Design Decisions: What I Chose — and What I Explicitly Rejected
Each of the following was a real fork in the design. The rejected paths weren't wrong — they were wrong
for this specific user context.
Layout Architecture
✕ Rejected
Tabbed Navigation
Tabs hide context. A portfolio manager switching between Risk Matrix
and Order Book loses the cross-correlation signal — the P&L movement that caused them to
check the book in the first place.
✓ Chosen
Persistent Panel Grid
All primary views visible simultaneously. Panels are resizable but
never hidden behind navigation. Matches the multi-monitor mental model of experienced desk
traders.
Order Book Rendering Technology
✕ Rejected
SVG-based Order Book
SVG DOM manipulation at L3 tick frequency (10–50ms updates for a
liquid equity) causes visible jank above ~200 rows. DOM diffing overhead is incompatible with
the latency expectation.
✓ Chosen
Canvas-rendered L3 Book
Canvas repaints the entire price ladder each tick at a fixed cost.
Combined with virtual scrolling for the full order depth, this matches the performance profile
of production institutional terminals. Accessibility tradeoff acknowledged — screen-reader
fallback requires a separate DOM summary row.
Compliance Violation Surfacing
✕ Rejected
Post-Submission Error Modal
Standard retail pattern: submit order → receive rejection →
re-enter. In a professional desk environment this costs seconds and disrupts flow. Legal at ACY
confirmed the same problem for their manual compliance review workflow: violations found after
the fact require full re-documentation.
✓ Chosen
Pre-Trade Inline Validation
Position limit warnings, wash-trade flags, and concentration limits
surface in the order ticket itself as the trader types quantity. This mirrors how Bloomberg's
TOMS and ION's trading platforms handle compliance — the constraint is visible before
commitment, not after rejection.
Color System
✕ Rejected
Bloomberg Green-on-Black Clone
Pure imitation fails WCAG 2.1 AA contrast for financial data display
and creates brand confusion. More critically, green-on-black conflates semantic green (profit /
buy) with display green, causing parsing errors under stress.
✓ Chosen
Semantic Color System with Dual-Theme
Red/green reserved strictly for directional price semantics. UI
chrome uses neutral blues and ambers. Light mode for compliance/risk roles (printable,
auditable). Semantic consistency enforced across both themes so traders switching workspaces
don't re-learn color meaning.
Multi-Dimensional Analytics Integration
The right-side panel integrates 5 analytical dimensions simultaneously:
Sector Allocation Bar Chart: Portfolio exposure by industry (2015–2021 time series)
Stress Test Scenarios: Portfolio performance under Stress/Crisis/Montreal
conditions
S&P 500 Correlation: Live chart with 3 moving averages (Morning/Median/Closing)
tracking index correlation
EUR/USD Time Frame: Forex exposure impact with volume distribution
Design Rationale: Institutional portfolio managers don't look at funds in isolation.
They evaluate systematic risk, correlation exposure, and macro sensitivities. This multi-panel layout
supports portfolio-level construction decisions, not individual security selection.
5. Level 2 Order Book: Market Microstructure
The Order Book is the most critical institutional trading interface — where professional
traders analyze market depth, liquidity concentration, and optimal execution pricing. The design
logic for this component was directly informed by my production work on ACY Connect.
By mapping raw FIX 4.4 protocol logic from our Tech Lead and QA (handling Partial Fills,
Iceberg Orders, execution reports, and snapshot updates), I gained the technical
intuition needed to design a terminal UI that correctly represents market microstructure
and liquidity heat maps at institutional scale.
Level 2 Order Book · Real-Time Market Depth with Bid/Ask Heat Map & Quick
Execution Controls
What is an Order Book (and Why It Matters Institutionally)
In retail trading platforms (my LogixTrader work), users see a single "current price" (last traded
price). Institutional traders need to see the entire order book — all pending buy
orders (bids) and sell orders (asks) at different price levels. This is called Level 2 market
data.
Why this matters: A portfolio manager executing a $10M equity order can't just "market
buy" — they need to see if there's enough liquidity at the current price, or if their order will move
the market (slippage). The Order Book visualizes this liquidity distribution.
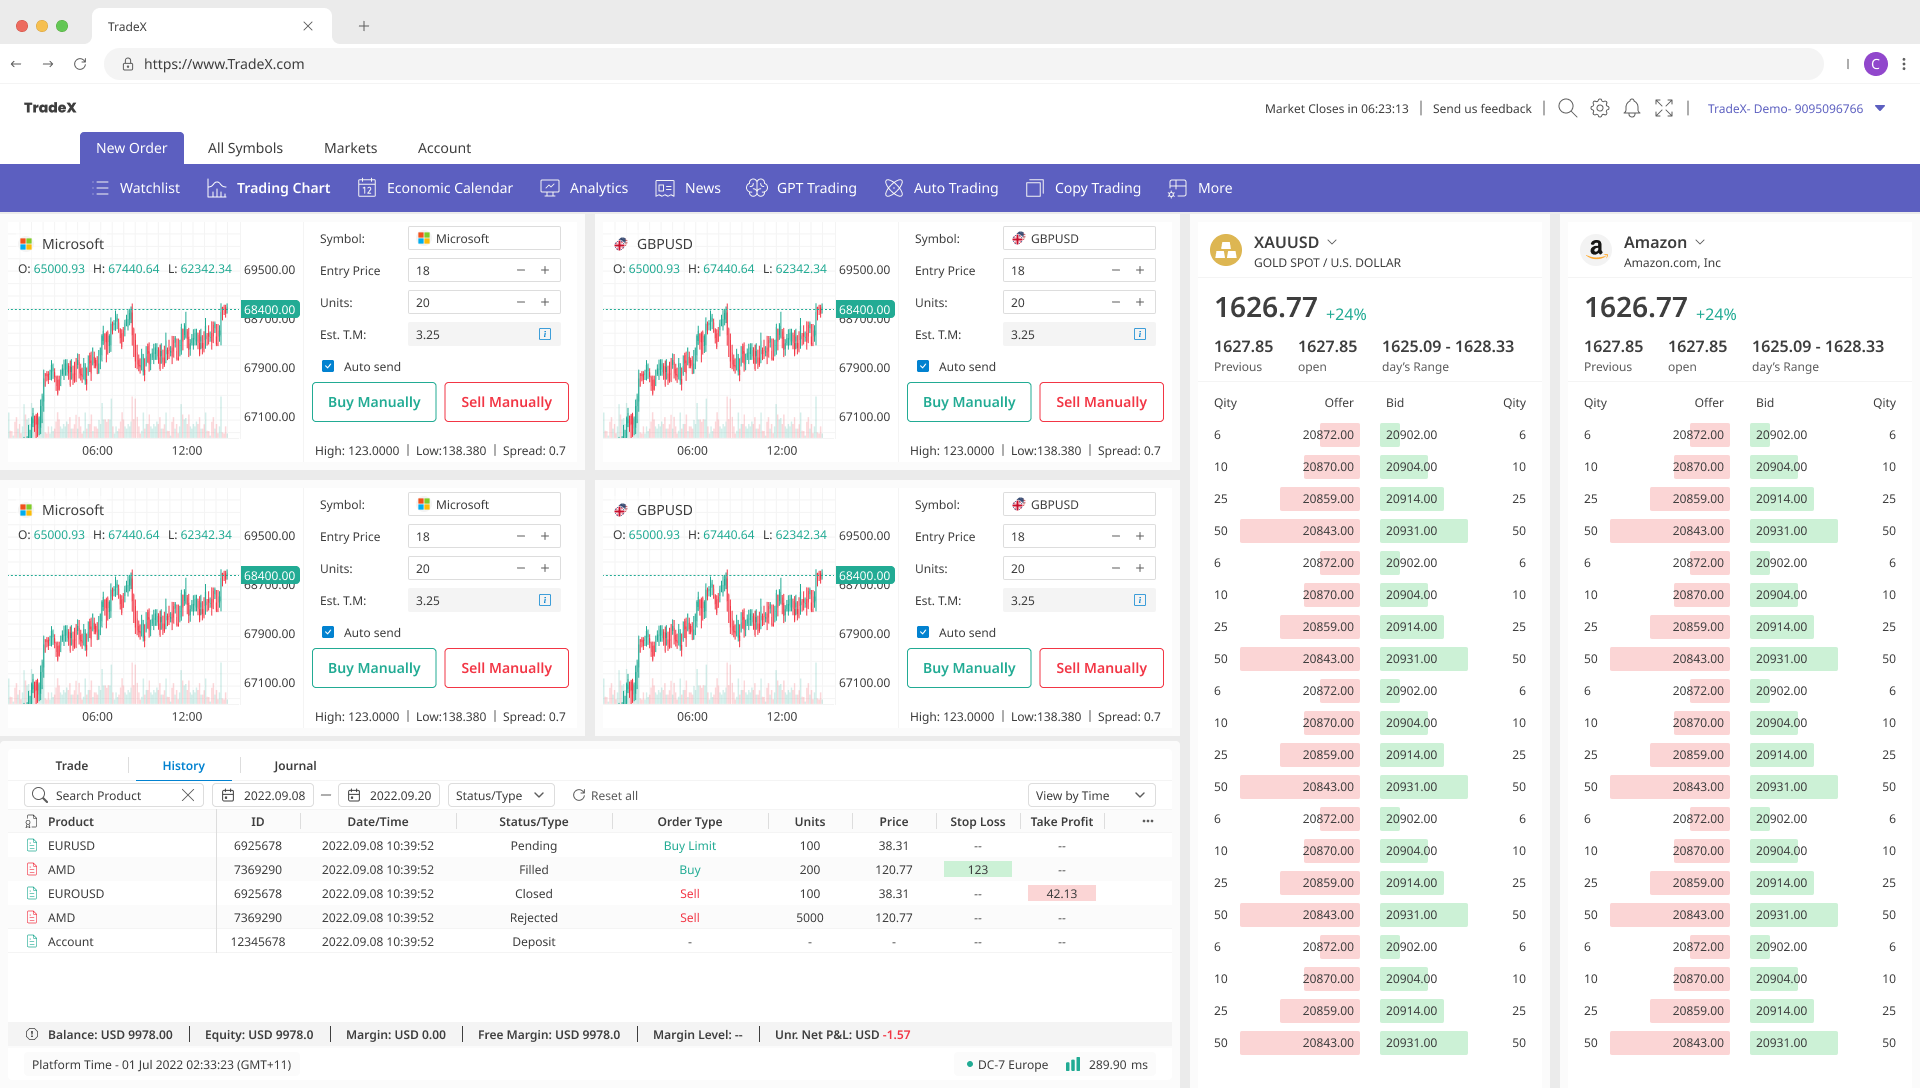
Solution: Bid/Ask Depth Heat Map
TradeX's Order Book uses color-coded heat mapping to visualize liquidity concentration
instantly:
Left Column: Bid Side (Buy Orders)
Qty
Bid Price
Visual
6
20872.00
Light
Green
50
20843.00
Dark
Green
Darker green = higher quantity (more liquidity at
that price level). Traders can instantly see where large buy orders are concentrated.
Right Column: Ask Side (Sell Orders)
Ask Price
Qty
Visual
20902.00
6
Light
Red
20931.00
50
Dark
Red
Darker red = higher quantity (more sell pressure
at that level). Identifies resistance zones where large sellers are waiting.
Quick Execution Interface
The Order Book integrates one-click execution controls directly alongside market depth
visualization — eliminating context switching between analysis and execution:
Execution Controls (Per Symbol Card)
Entry Price: Adjustable via +/− buttons (default: current market price)
Units: Position sizing with +/− controls (supports fractional shares)
Est. T.M. (Total Margin): Real-time margin calculation based on account equity
Auto Send Checkbox: Skips the human confirmation step only. Pre-trade risk checks
(SEC Rule 15c3-5 position limits, wash-trade flags, concentration limits) remain mandatory and
cannot be bypassed by this control.
Design Rationale: Professional traders executing 50-200 trades/day need
zero-click workflows. The "Auto Send" mode enables keyboard-only execution: Tab to
Units → Enter value → Spacebar to execute. No mouse required.
Trade History Integration
Below the Order Book, TradeX displays a real-time Trade History panel with granular
status tracking:
Field
Data Type
Purpose
Status/Type
Buy
Limit
Order classification (Pending, Filled, Closed, Rejected)
Units
100, 200, 5000
Position size per trade
Price
38.31, 120.77
Execution price (or limit price if pending)
Stop Loss
123
Risk management threshold (auto-close if price hits)
Take Profit
42.13
Profit target (auto-close when reached)
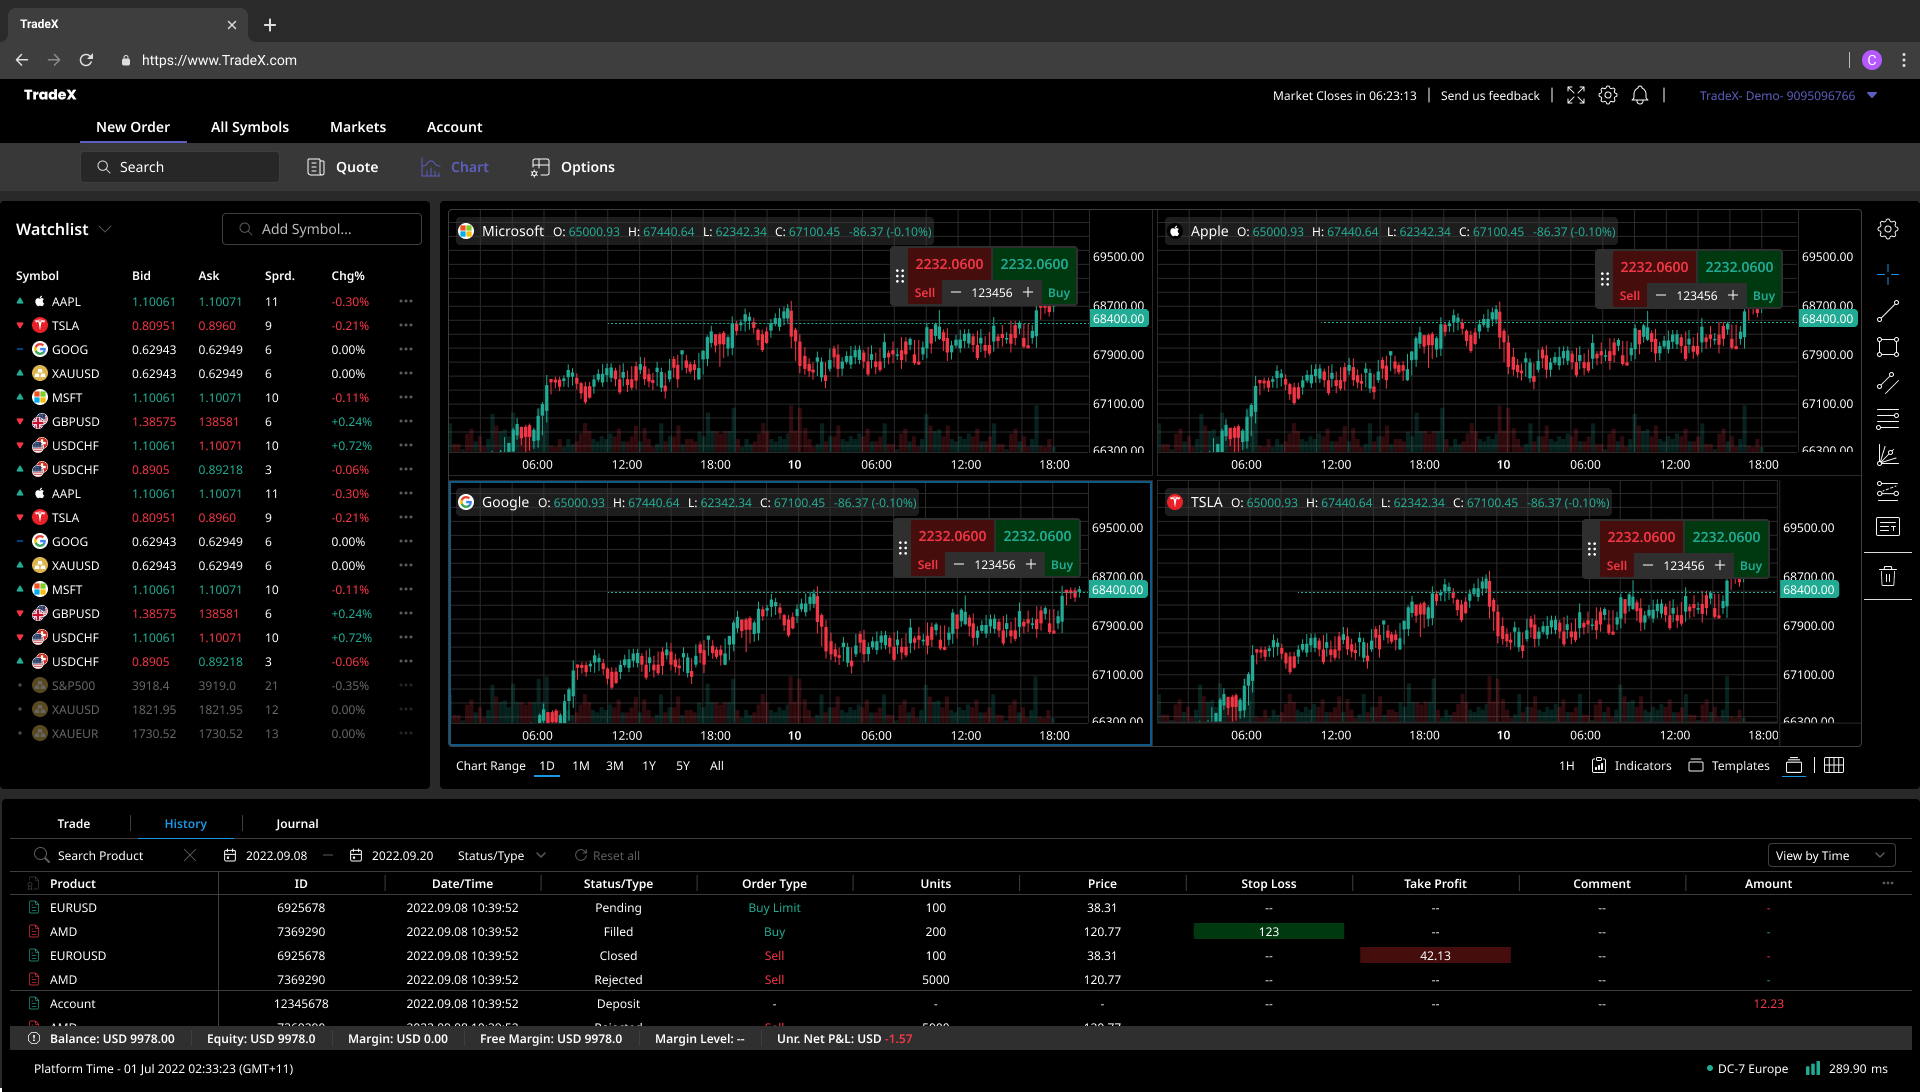
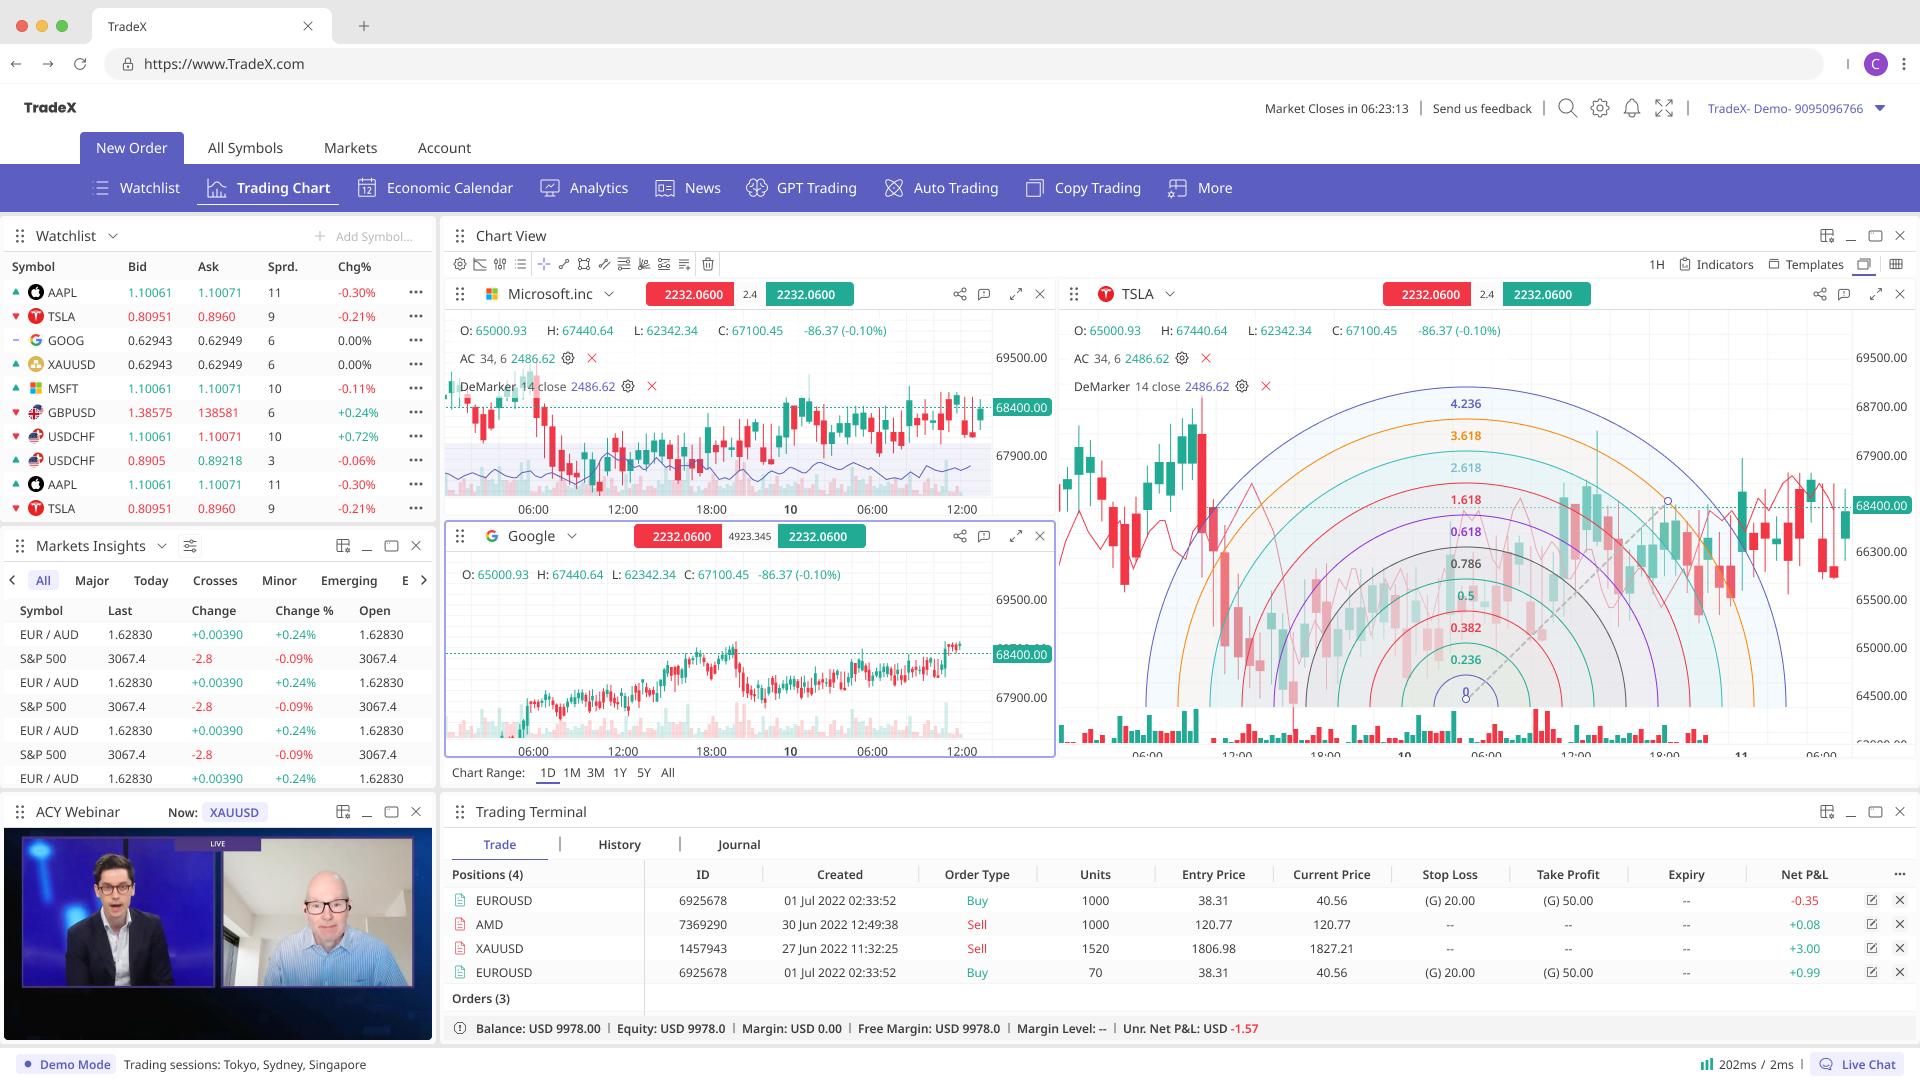
6. Multi-Chart Orchestration
Multi-Chart Dashboard · 4-Panel Synchronized View with Real-Time P&L
Tracking
Challenge: 4 Simultaneous Charts Without Cognitive Overload
Portfolio managers monitoring multiple positions (Microsoft, Apple, Google, Tesla simultaneously) need
synchronized time-frame controls — changing one chart's time range should update all 4 charts. This is a
coordination challenge absent from single-chart retail platforms.
Solution: Unified Time-Frame Controller
Bottom-right chart controls: 1D, 1M, 3M, 1Y, 5Y, All buttons globally adjust all 4
charts simultaneously.
UX Rationale: Institutional traders analyze correlation patterns
(e.g., "How did Microsoft and Apple move together during last month's Fed announcement?"). Synchronized
time frames enable comparative analysis without manual re-adjustment per chart.
Terminal Orchestration: The Multi-Monitor Engine
Standard B2B SaaS design stops at the browser tab. Institutional terminal design starts at the
workspace level. Top-tier traders at Goldman or BlackRock use 4–8 monitors; TradeX's
architecture was designed to manage this Stateful Orchestration.
Cross-Window
Synchronization
Using BroadcastChannel API and SharedWorkers, TradeX keeps multiple windows in sync — clicking a ticker on Monitor 1 updates the order book on Monitor 3 and news sentiment on Monitor 4. Browser-based sync typically achieves 100–200ms latency, which works for portfolio monitoring and position management. True sub-50ms sync (required for high-frequency execution) would need native terminal architecture like Bloomberg's C++ infrastructure.
Contextual
Persistence
Workspaces are treated as Versioned Snapshots. If a trader moves from a "Macro
View" to an "Earning Season View," all 8 monitors must re-provision their specific layouts and data
streams simultaneously, preserving the "Ticker Context" across the entire physical desk.
Principal Design Perspective:
Designing for multi-monitor setups requires moving beyond 12-column grids into Spatial
Orchestration. I de-prioritized "visual comfort" in favor of "Peripheral Awareness" — using
color-coded luminance shifts on secondary monitors to signal market alerts while the primary monitor
remains focused on execution. This is systemic design at the environment level.
Watchlist Integration
Left sidebar displays a live watchlist with 15+ symbols showing Bid, Ask, Spread, and
24hr Change%. This mirrors Bloomberg Terminal's "Monitor" panel — professional traders don't navigate to
symbols via search; they maintain persistent watchlists of their coverage universe.
7. Adaptive UI
Light Mode · Fibonacci Technical Analysis with Integrated Live Webinar Panel
Why Light Mode Matters Institutionally
Most institutional terminals (Bloomberg, FactSet) default to dark mode for 10+ hour trading sessions
(reduced eye strain). But compliance officers, risk managers, and regulatory reviewers
often work in well-lit office environments where dark mode causes glare on printed materials.
Design Decision: Dual-Theme Architecture
TradeX supports both dark (traders) and light (compliance/risk) themes with preserved data
visualization:
Dark Mode: Pure black (#000000) with neon accents (Cyan #00D1FF, Lime #4CAF50,
Amber #FFAA00)
Light Mode: Off-white (#F5F5F5) with high-contrast typography (80%+ black text on
light backgrounds)
Consistent Across Themes: Red/green price movements, chart candlestick colors, and
risk severity indicators remain identical (ensures muscle memory transfer)
Institutional traders (particularly in commodities, forex, and equity derivatives) extensively use
Fibonacci retracement/extension tools and Gann analysis for
identifying key price levels and time-based cycles. Bloomberg Terminal, Thomson Reuters Eikon, and
TradingView Pro all provide these tools as standard features for professional market analysis.
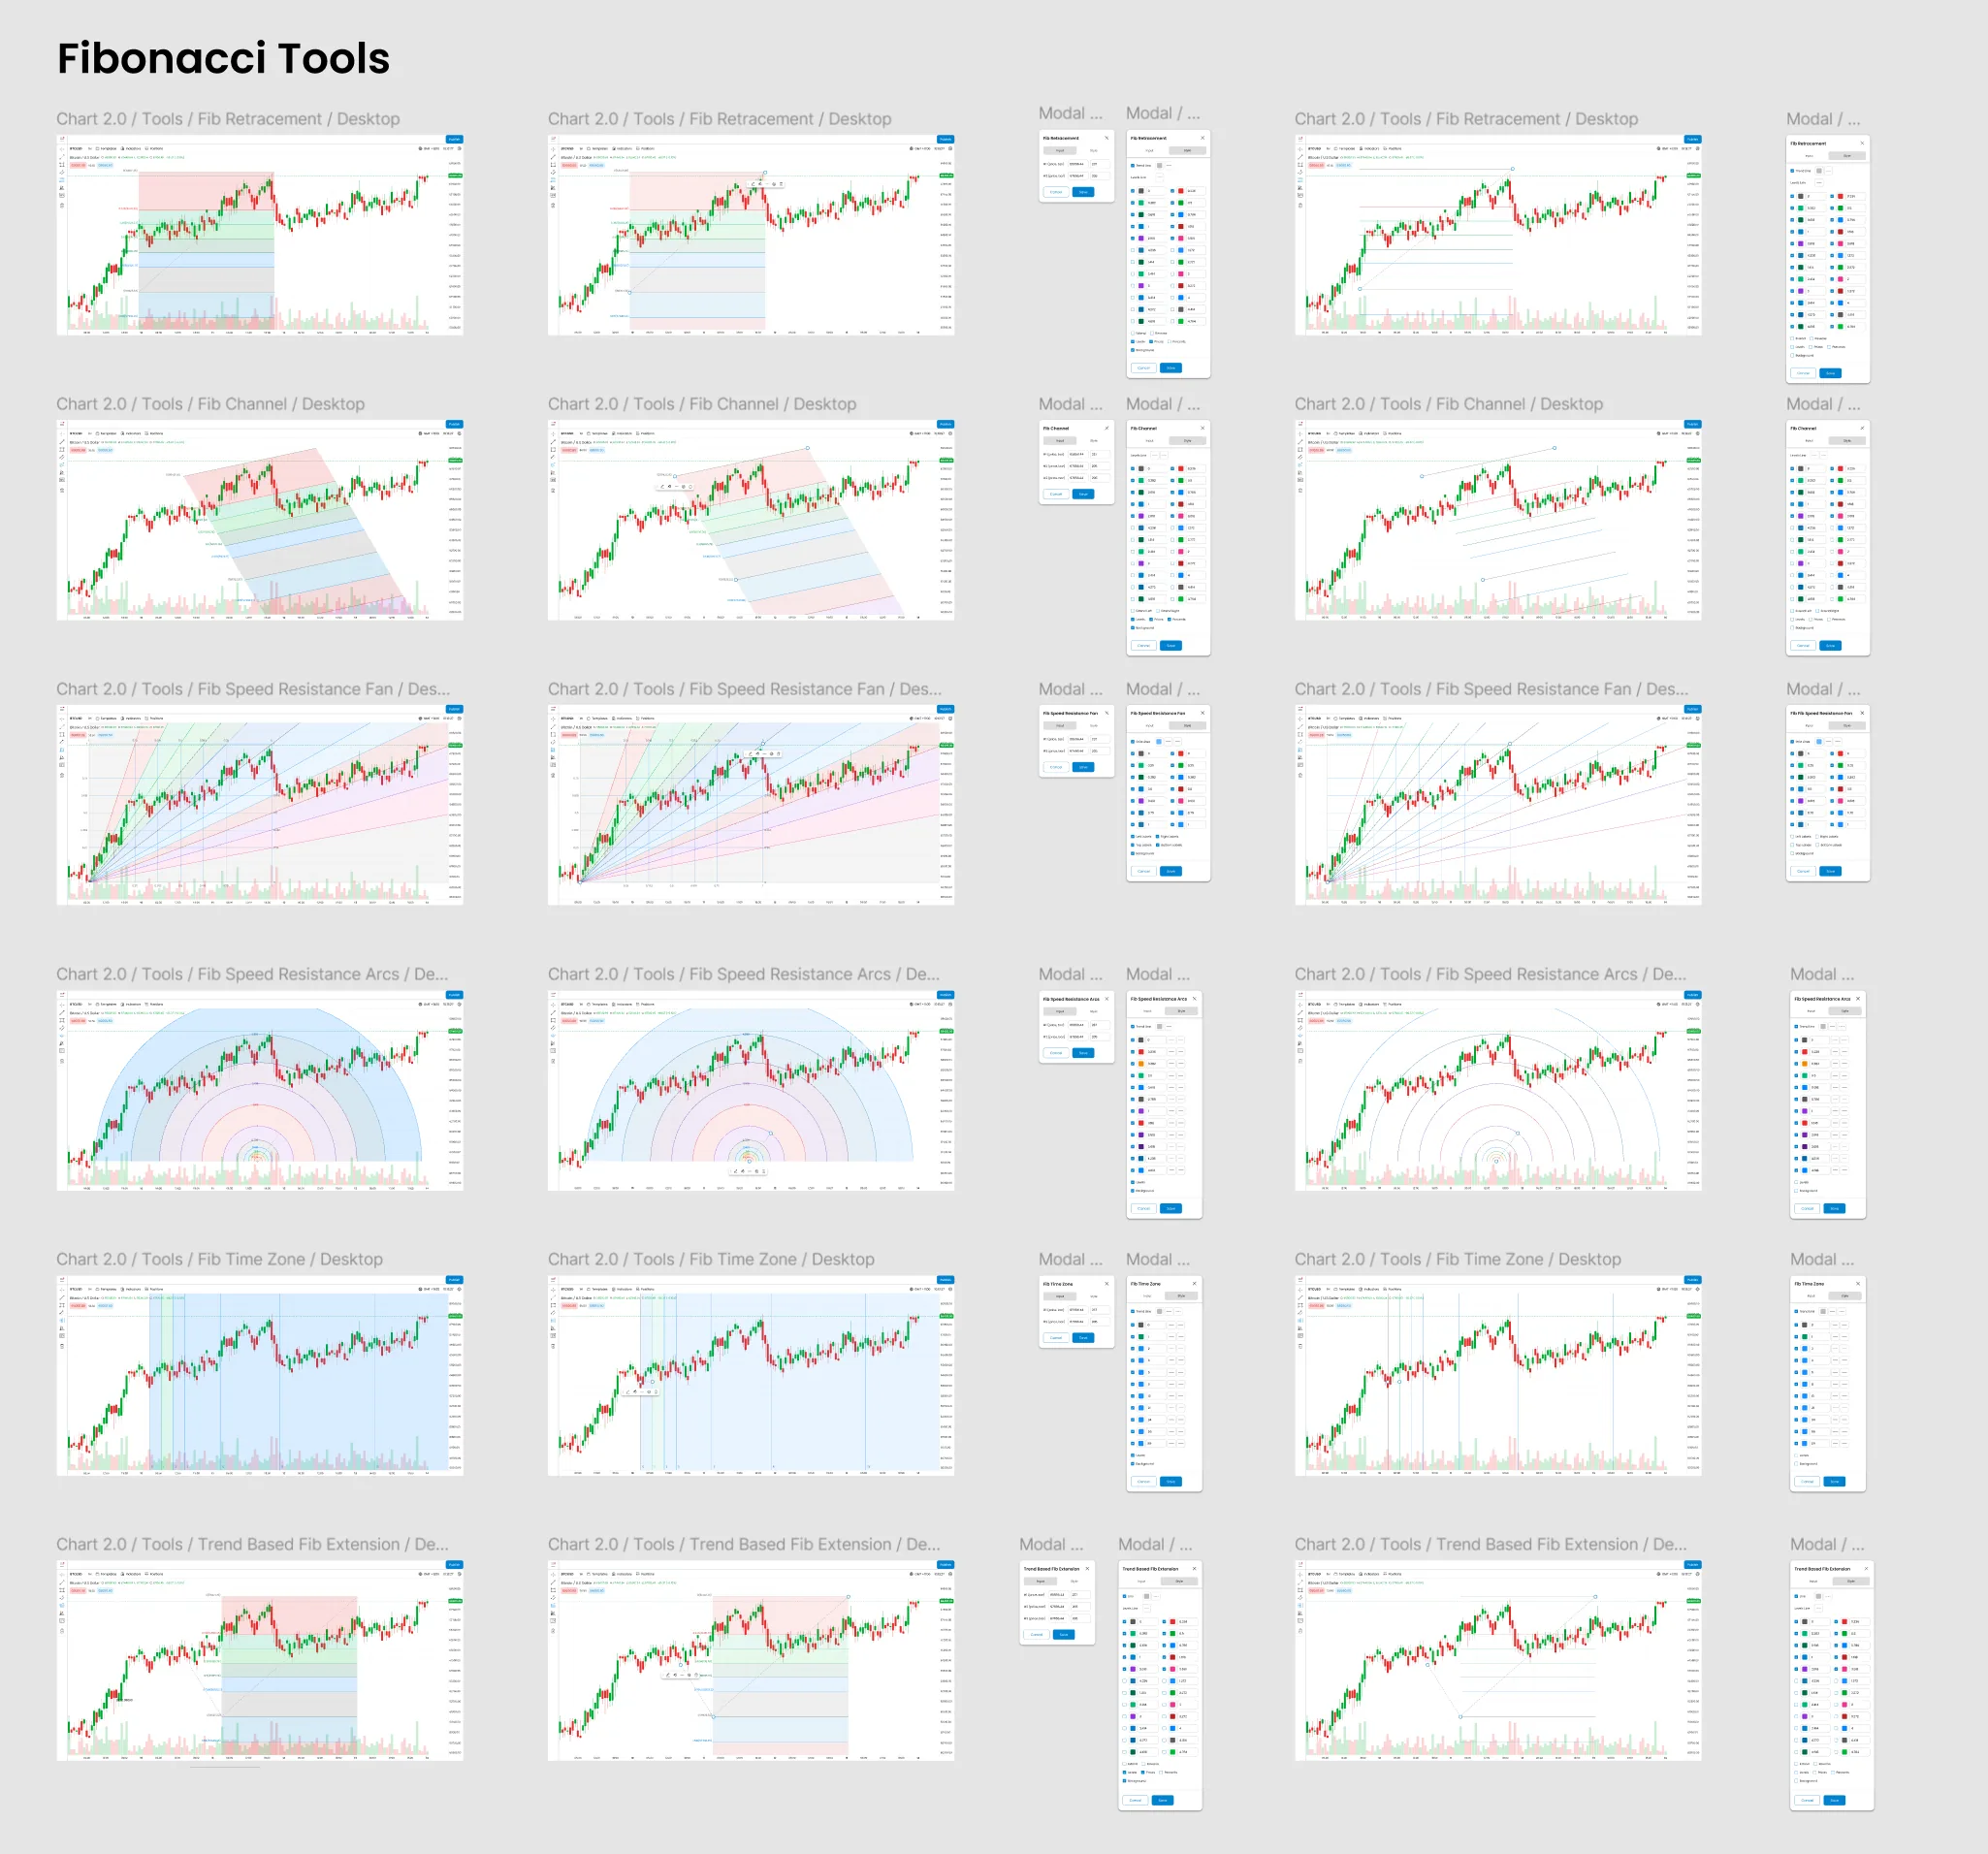
Fibonacci Tools Suite · Institutional-grade retracement, channel, and
time-based analysis
Why Fibonacci Matters Institutionally
Fibonacci tools are not "mystical" — they're self-fulfilling prophecy patterns.
When thousands of institutional traders watch the same 61.8% retracement level, it becomes a real
support/resistance zone due to clustered order flow.
Fib Channel: Parallel trend channels with Fibonacci spacing for breakout
zones
Fib Speed Resistance Fan: Angular support/resistance lines from trend origin
Fib Arcs: Curved support/resistance zones based on price distance
Fib Time Zone: Vertical lines at Fibonacci intervals (predicting reversal
timing)
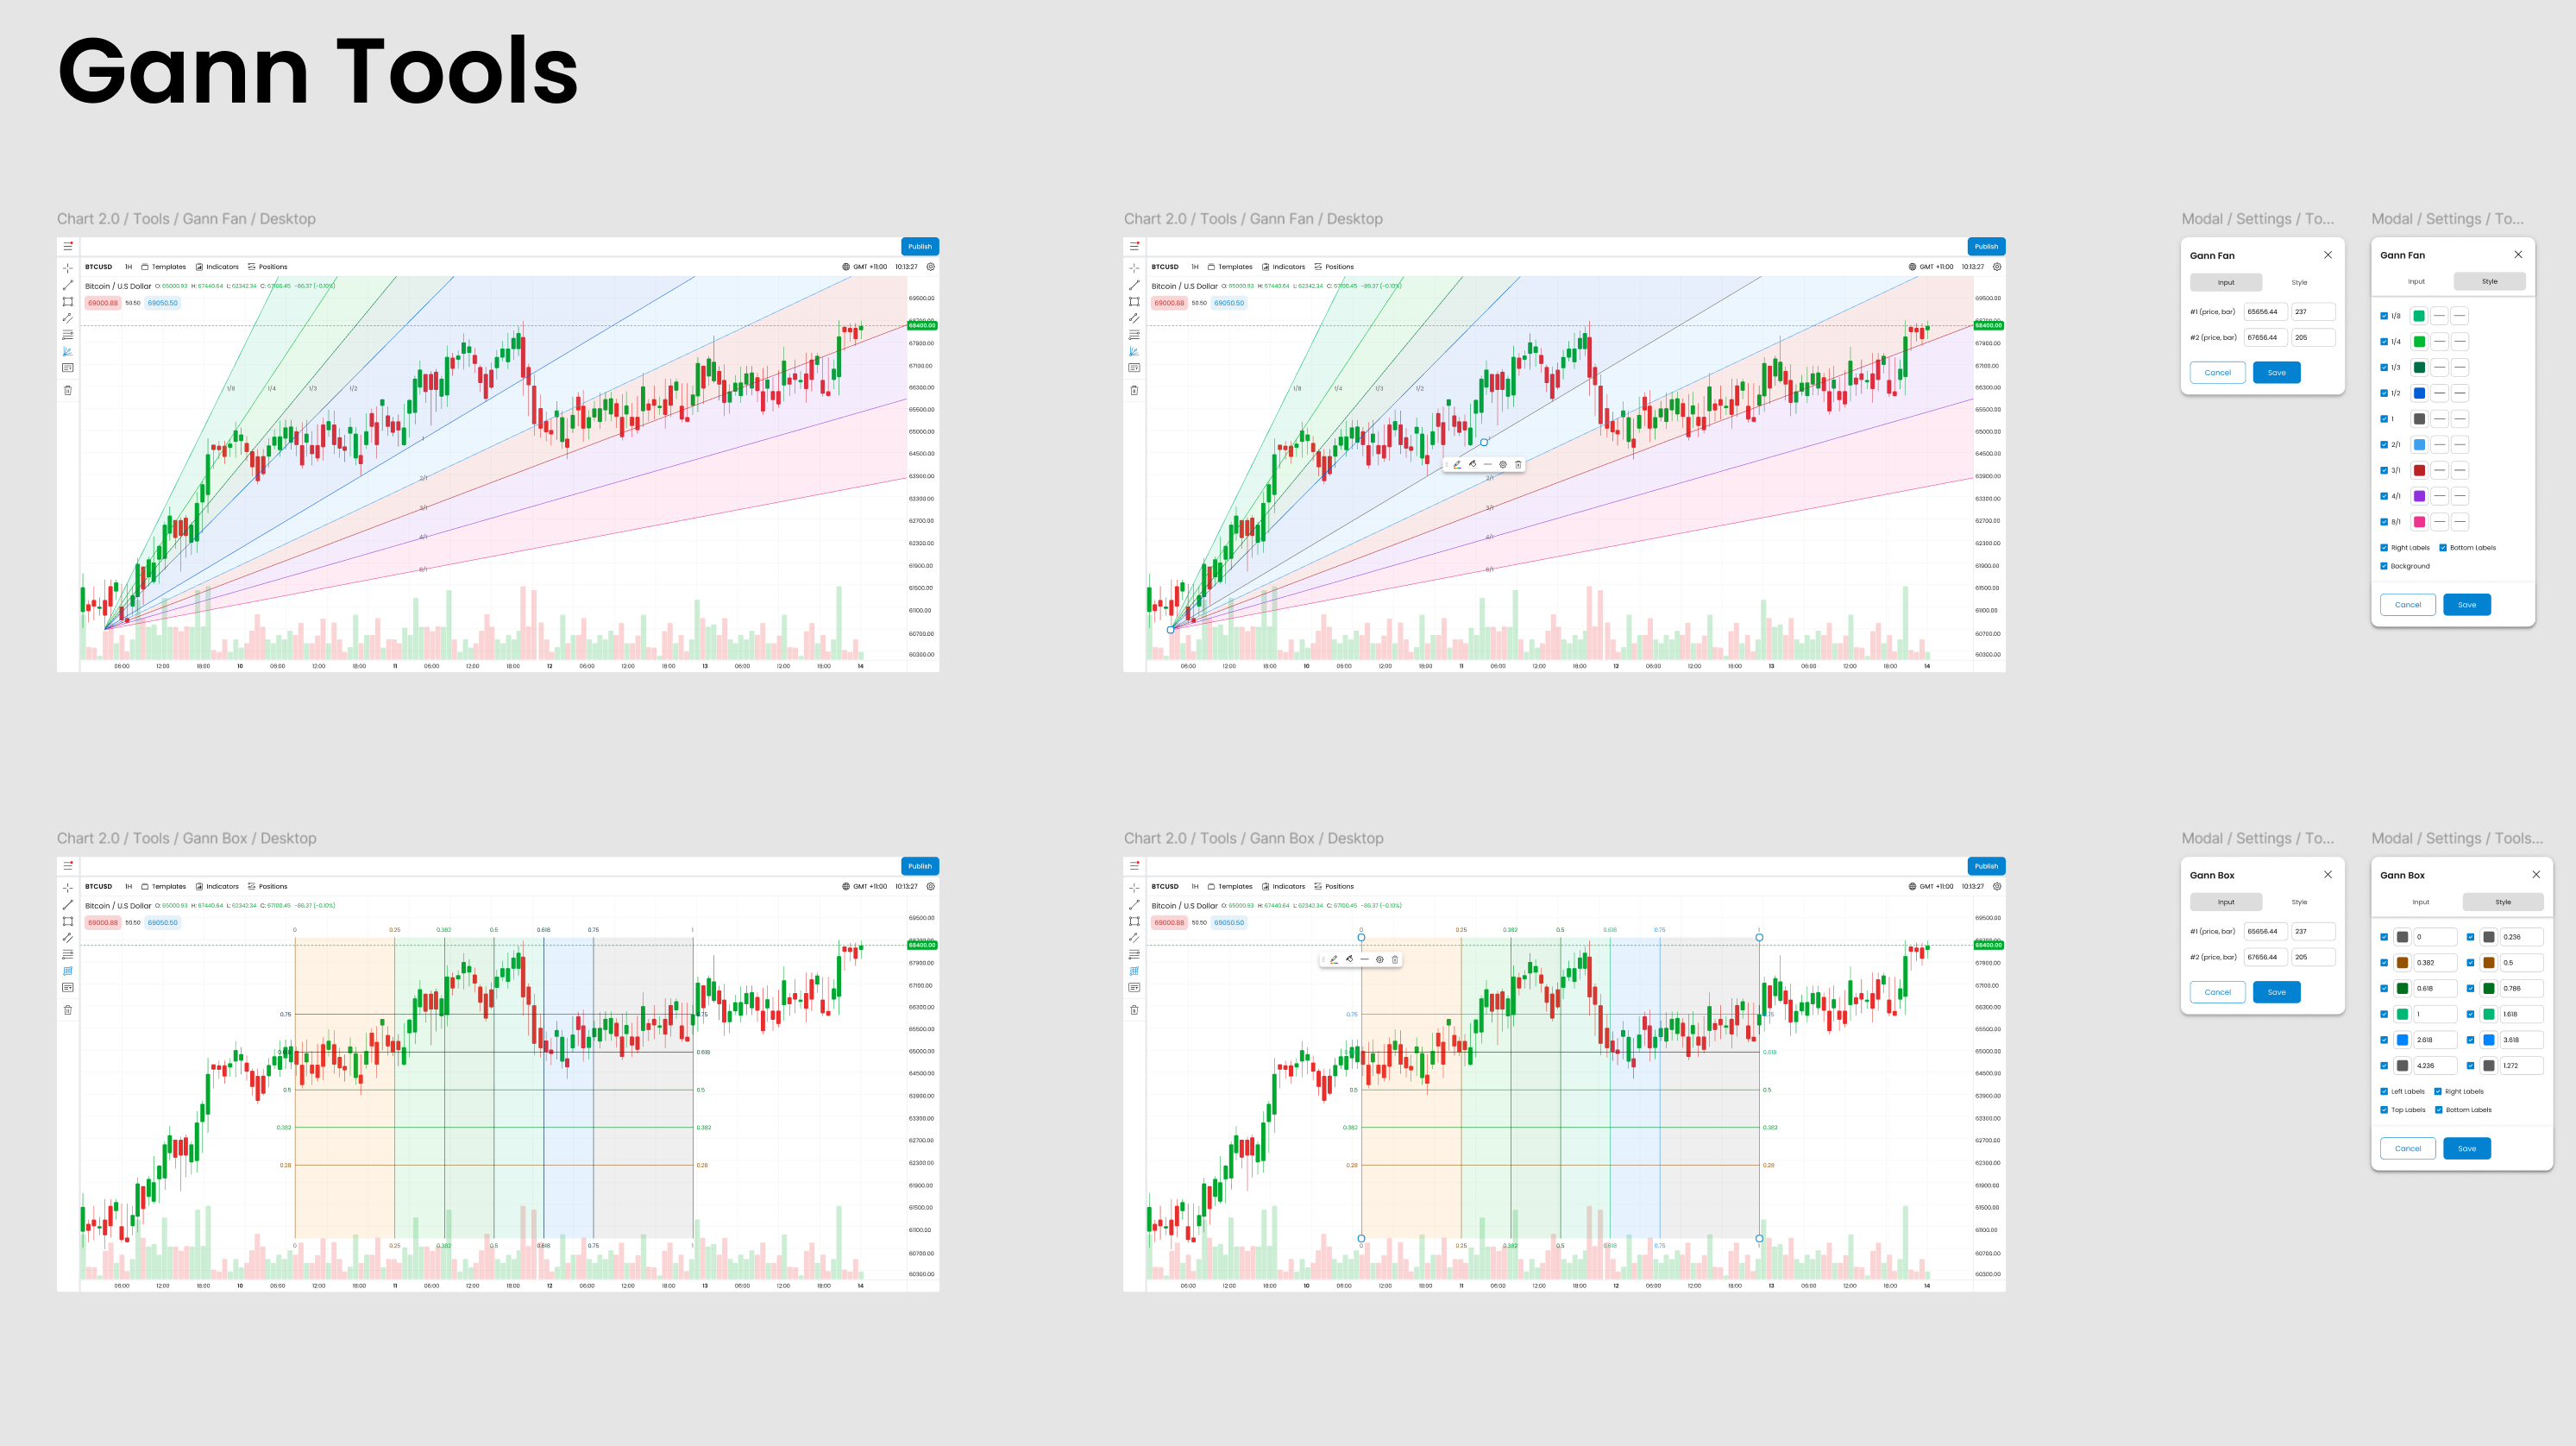
Gann Analysis Tools · Price-time relationship mapping for cycle-based
trading
Why Gann Matters Institutionally
W.D. Gann's price-time analysis methods are used by commodities traders and forex
strategists to identify cyclical patterns. Gann Fans (45° angle lines) and Gann Boxes
help institutional desks predict major market turning points.
Gann Box: Price-time square grid dividing trends into geometric segments
1x1 Line (45° angle): Represents "perfect balance" between price and time
Real-World Use: CME Group traders use Gann analysis for S&P 500 futures;
forex desks at Deutsche Bank and Citi apply Gann Fans to EUR/USD major trend analysis.
What This Demonstrates for Institutional Finance Roles
Building out the full technical-analysis toolset is how I demonstrate:
Professional Trader Workflows: Institutional platforms must support quantitative
analysis (algorithmic trading) AND discretionary technical analysis (human pattern recognition)
Multi-Strategy Support: Different trading desks use different methodologies —
equities desks favor moving averages, commodity traders rely on Fibonacci, forex teams use Gann
cycles
Tool Parity with Bloomberg: Any institutional terminal competing with Bloomberg
Terminal MUST provide equivalent charting tools (Fibonacci, Gann, Elliott Wave, Ichimoku Cloud)
Configurability > Simplicity: Unlike retail platforms that hide complexity,
institutional UIs expose ALL tools and let power users customize their workspace
Design Philosophy: Retail platforms optimize for "ease of use" (reducing cognitive
load). Institutional platforms optimize for "depth of analysis" (maximizing analytical power). TradeX
embodies this institutional mindset by providing professional-grade technical tools without UI
hand-holding.
Collaboration Integration: Live Webinar Panel
Bottom-left corner shows an ACY Webinar video feed. This represents a unique
institutional requirement: real-time analyst commentary. Bloomberg Terminal offers
similar functionality through Bloomberg TV integration — traders watch market analysis while monitoring
positions.
Design Insight: Institutional trading isn't solo work. Traders coordinate with research
analysts, risk managers, and compliance officers via integrated communication tools (video, chat, voice).
TradeX's webinar panel demonstrates understanding of this collaborative workflow.
8. What This Shows
TradeX demonstrates that I understand the architectural differences between retail and
institutional finance UX — critical knowledge for designing platforms serving portfolio
managers and wealth advisors:
Production Work (Retail/Broker)
LogixTrader: Web trading (15-30 metrics per screen, single-chart focus)
Core Transferable Skills for Institutional Finance Roles
1. Extreme Data Density Design
Institutional platforms like Bloomberg Aladdin display 200+ risk metrics per portfolio. TradeX's
960-datapoint Risk Matrix demonstrates the information architecture approach required for scannable
hierarchies at institutional scale.
2. Market Microstructure Understanding
Order Book design demonstrates knowledge of bid/ask spreads, market depth, and liquidity
visualization — including the handling of Partial Fills and detection of
Iceberg Orders (splitting large orders into smaller chunks to hide size from the
market). These are critical for any institutional trading platform serving professional market
participants.
3. Multi-Asset Class Orchestration
Professional traders monitor equities, forex, commodities, and derivatives simultaneously. TradeX's
multi-chart synchronization mirrors multi-asset institutional terminal architecture.
CONCEPT EVOLUTION
From Institutional Terminal to AI-Native Hedge Fund
Dashboard
The Portfolio Risk Matrix and Compliance architecture in this project form the structural foundation
for a deeper exploration: what happens when you rebuild this terminal from scratch with intelligence-first
architecture — no legacy constraints, no incremental feature additions?
TradeX: Designing the Dashboard
Bloomberg Can't Build answers that question across 8 views.
This Project: Institutional Terminal
Portfolio Risk Matrix · Static density architecture
Evolution: Hedge Fund Portfolio Interface
Fund Performance & Risk Analytics · Live macro correlation
This Project Establishes
Data density architecture (960 data points)
Compliance matrix with SEC audit trails
Order Book microstructure visualization
Keyboard-first execution design
Hedge Fund Screen Adds
Live macro correlation panels (Sector / Regional / S&P)
The gap between "institutional terminal" and "exchange-grade infrastructure" is defined by what lives
below the chart. L3 order book depth, venue routing intelligence, microstructure analytics,
real-time TCA, and T+0 settlement visibility are the layers that separate Bloomberg from consumer-grade terminals. The
interactive prototypes below demonstrate each layer.
L3 Order Book — Full Depth, Individual Order Resolution
L2 aggregates by price level. L3
shows every individual order in the queue — the institutional standard for execution timing and informed
flow detection.
AAPL · L3 Order Book ·
NASDAQ
09:31:04.847
LIVE
ORDERSSIZEBID
SPREAD
ASKSIZEORDERS
Market
Microstructure Panel
Toxic flow detection, adverse
selection metrics, and order flow quality — unavailable in any retail terminal. This panel answers:
are informed traders positioned against me right now?
Kyle's Lambda
0.0032
↑ Info asymmetry elevated
Toxic Flow %
23.4%
⚠ Above threshold (20%)
Trade-to-Quote
0.0012
✓ Normal range
Realized Vol (5m)
18.2%
vs Implied Vol 19.7%
Bid-Ask Spread
1.8 bps
Today avg: 2.1 bps
OFI (5s window)
+14.2%
Bid-side imbalance
Smart Order
Router — Venue Allocation
Real-time routing decisions
across lit markets, dark pools, and off-exchange venues. Not a black box — institutional desks need to
know if they're being front-run by their own router.
VENUEFILL%REBATELATENCYALLOCATION
Real-Time TCA
— Transaction Cost Analysis
Every fill measured against
arrival price — live, not end-of-day. Alpha attribution is meaningless if you can't distinguish genuine
skill from favorable execution conditions.
TIMEARRIVALFILLSLIP(BPS)VENUESTATUS
T+0 Settlement
Tracker (2026 Standard)
Post-SEC T+1 mandate with
movement toward T+0. Risk management doesn't end at execution — it runs through CCP clearing and DTC
confirmation.
Why This
Layer Is the Real Institutional Qualifier
Retail terminals show price. Professional terminals show market depth. Exchange-level infrastructure
shows why the market is moving — toxic flow, information asymmetry, venue liquidity
fragmentation. Kyle's Lambda tells you if someone smarter is trading into your position. The SOR tells
you whether your broker is optimizing your fill or their rebate. TCA tells you the real cost of your
decision. In 2026, a terminal without these layers is a retail terminal wearing an institutional suit.
React Prototype · Figma Make
Explore the Full Terminal
12-screen interactive terminal built in React + shadcn/ui — Dashboard,
Trading, Portfolio, Risk Matrix, Factor Exposure, Execution Analytics, Compliance, and more.
Retail platforms design for the 80% happy path. Institutional terminals design for the 1% catastrophic scenario.
The Portfolio Risk Matrix exists for the day the market breaks — when a PM running a $5B book has to pick the five VaR-breaching funds out of eighty before the next print. That's not progressive disclosure. That's density, severity color, and a keyboard that assumes the trader's hand never leaves it.
Retail dashboards lie by simplifying. Institutional terminals lie by overloading. I've built on both sides, and I've picked a side: the defensible design is the one that tells the trader what they need in the five seconds before the market moves — not the one that looks clean in a marketing screenshot.
My production portfolio (LogixTrader, Finlogix, TradingCup) proves I can ship retail/broker fintech
products. TradeX demonstrates that I understand institutional-grade requirements —
directly applicable to roles where design targets professional portfolio managers, not retail investors.
What this case study evidences · and what it doesn’t
For a Senior PD or Design Lead interview panel.
This concept evidences institutional terminal thinking applied to buy-side execution: Portfolio
Risk Matrix at 960 data points without cognitive overload, Level-2 microstructure visibility with
keyboard-first cancel/modify, multi-chart orchestration, dual-theme architecture, technical
indicator discipline (Fibonacci, Gann). Regulatory anchors named by section: SEC 17a-4 audit
retention, FINRA Rule 2111 suitability, FIX 4.4 ExecutionReport state machine. Production
foundations (ACY Connect FIX 4.4 institutional API) ground the protocol literacy; the
buy-side institutional terminal is the explicit concept extension.
What this case study deliberately does not claim. Not in production — concept
artifact, no live exchange data, no real FIX execution path, no validated quant models, no PM user
testing, no SEC 17a-4 certification. No certified WCAG 2.1 AA conformance — full disclosure
at the
accessibility audit
disclosure. No paired-within-subjects statistical claim like Finlogix — the parallel
methodology rigor for any future quantitative claim would follow the
Finlogix methodology
disclosure. No post-launch iteration data because there is no launch — the parallel
for hypothetical production would follow the
ACY RG 268
iteration arc. The enterprise-IT political-skill arc for institutional terminal adoption is
documented at the
ACY Connect
political-skill note — the institutional adoption pattern (verification surface as
adoption mechanism) applies directly.
The disclosure register. The four 2026-05-18 field notes are the canonical voice
this concept inherits from. The TradeX Institutional Terminal is one of three institutional
studies (alongside Praxis Prime F2B and Hedge Fund PM cognition) that together map the complete
institutional workflow under one disclosure discipline.
Every problem we solve for clients has multiple valid approaches — different costs, different ROI, different risk profiles. These threads show how the approach on this page compares to others in the portfolio.
Thread
Regulatory Routing & Disclosure
How upstream regulation and macro prints become downstream product defaults and Legal-safe disclosure.