Tier 01
Public evidence
Verifiable by anyone through public sources. Awwwards nominations, ASIC public records, jurisdictional disclosures visible in website footers.
Every number cited here will be questioned by Legal, validated by Product, scrutinised by Engineering. This page is the answer. Four evidence tiers, transparent formulas, attribution-honest claims. Confidential employer data is paraphrased, not exposed — the same discipline I'd bring to your data.
Machine-readable structured data — every claim, source, formula, and sample size in one file.
The Framework
Public evidence first, NDA paraphrase last. The tier is always disclosed alongside the number. Reviewers can verify Tier 1 themselves; Tiers 2–4 unlock progressively in interviews.
Tier 01
Verifiable by anyone through public sources. Awwwards nominations, ASIC public records, jurisdictional disclosures visible in website footers.
Tier 02
Hotjar, Google Analytics 4, Search Console. Sample size and date range disclosed. Live dashboard walkthrough in video interviews.
Tier 03
Confidential business metrics presented as relative changes ("+35% improvement") with methodology disclosed but exact values withheld. Final-round disclosure under bilateral NDA.
Tier 04
Sanitised investor-deck templates, FY26/27 financial framing artefacts, C-level strategic feedback summaries. Walkthroughs in final interviews.
Why this page exists
I'm a designer, not a data scientist. But every design decision I make has consequences Legal, Engineering, and the CFO will ask me to defend. This framework is how I answer them — with rigor, attribution, and the same confidentiality I'd carry into your team.
Question 01 · Legal
Answered with eye-tracking samples, scroll-depth analytics, and interaction logs. Not a screenshot of the disclaimer; evidence the disclaimer was read.
Question 02 · Engineering
Answered with controlled usability data, before/after times, sample size, and statistical caveats. Cohen's d only when the test design supports it.
Question 03 · CFO
Answered with implementation-time delta against baseline period and explicit confounding factors (TypeScript migration ran in parallel — not all gain is design system attribution).
Attribution Discipline
Most designer portfolios over-attribute team outcomes. Mine doesn't. The line between "I designed this" and "the company reported this" is drawn explicitly on every claim.
Principle 01
User behaviour (task time, error rates, time-on-task), system adoption (component reuse rate, design system uptake), and compliance outcomes (zero design-related regulatory findings).
Principle 02
Revenue, user growth, conversion rates. These are team outcomes driven by Product, Marketing, Engineering — not design alone. Company-wide metrics are attributed to source, not to me.
Principle 03
Three tiers: public evidence anyone can check, analytics screenshots in interviews, confidential data shown as directional estimates with methodology. I won't compromise a previous employer's confidentiality to make my portfolio look better.
Calculation Methodology
Every quantitative claim in the portfolio is backed by a transparent formula. Below: the math, the sample, the confounders that should keep you skeptical of the headline number.
Formula 01
Baseline 3 days/component (n=10, 6-month pre-system) vs. 2 days (n=20, 9-month post-system). Reported as range to absorb engineer-level and component-complexity variance. Confounders: TypeScript migration ran in parallel — not all gain attributable to design system. Directional, not causal.
Formula 02
Moderated lab test, n=15 (5 novice / 7 intermediate / 3 expert). Within-subjects, ±0.2s manual timing. Cohen's d > 3.0 (very large, estimated; no published t-statistic) — expected, since steps were cut 6→2. Limitations: learning effect not counterbalanced, lab ≠ live trading stress.
Formula 03
187K organic clicks ÷ 31M impressions = 0.603% CTR over 12 months (Google Search Console). Attribution: SEO strategy was Marketing + Content. I claim only the UX-side scaffolding — page structure, Schema.org markup, Core Web Vitals.
Honest Assessment
Small samples done well are still small samples. The portfolio's strongest study (Finlogix, n=15 within-subjects) is a directional signal, not a guarantee. Naming that gap honestly is part of the methodology.
Why this matters for institutional roles: on retail platforms (100K+ users), fast exploratory testing drives shipping. At institutional scale — where one UX choice can affect billions in AUM or expose the firm to regulatory risk — design needs rigorous testing, peer review, and reproducible methods. I'm ready to partner with quantitative researchers and compliance teams to validate decisions to that bar.
Real-World Application
Each example below is one tier of evidence. Tier 1 examples can be checked right now; Tier 2 unlocks in interviews; Tier 3 stays paraphrased.
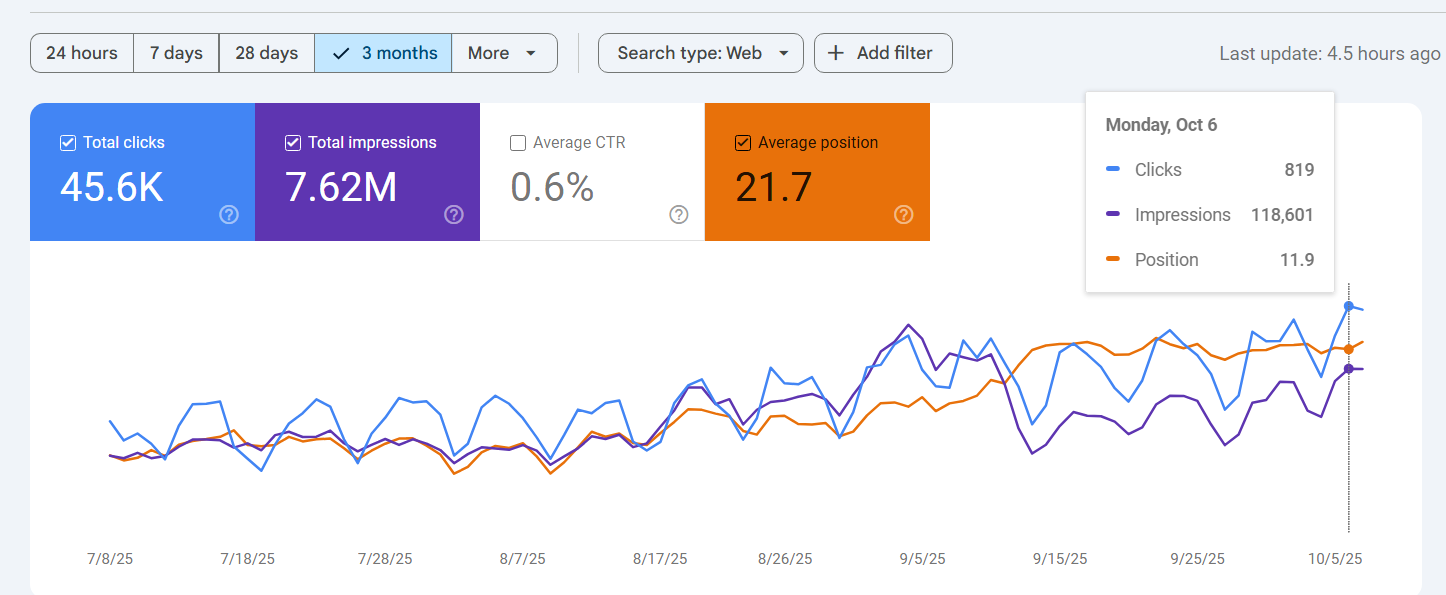
Tier 01 · Public
Google Search Console screenshot above. Live GSC dashboard walkthrough on request. CTR 0.6% / position 21.7 demonstrates discovery effectiveness — UX side, not the SEO strategy itself.
Tier 01 · Attribution
Company-wide metric, publicly stated by my former employer. I designed for a platform operating at this scale — I do not claim user-acquisition credit. Jurisdiction count verifiable in website footer regulatory disclosures (ASIC, FCA, CySEC, FSA).
Tier 02 · Analytics
Hotjar heatmaps + session recordings + GA4 engagement metrics drove design prioritisation. What I won't show: internal dashboard screenshots, session recordings, geographic distributions — these belong to my prior employer. Methodology walkthrough in interview; detailed data under NDA in final round.
Tier 01 · Live demo
Every metric on Macro Signal Network is derived from public APIs — FRED, SEC EDGAR, U.S. Treasury FiscalData, BLS. Reproducible end-to-end by any reviewer with an API key. Zero NDA risk; nothing paraphrased from a prior employer's dashboard.
Why I take the confidentiality stance: If I share a previous employer's internal data to land a new role, why would you trust me with yours when I eventually leave? This page demonstrates I can measure design impact rigorously while honouring professional confidentiality. In financial services, that's not optional.
Related work